0
$\begingroup$

So, my friend had an idea for a weird Post Apocalypse society traveling through space towards Proxima Centauri B, and she's trying to figure out where the population would be 50 and 100 years after the start. I tried to work out the math and got lost four times.

First, let's assume that for whatever reason, humans have been reduced to just 100 individuals as distantly related as possible. There is no larger group to join at the end of the journey.

Second, this groups consists of 25 males and 75 females. The synthetic intelligence has determined that dividing them up into family pods of 1 male and 3 females is the best setup to ensure both survival and genetic diversity. (Just to be clear, no, I don't know why she chose this arrangement, but I suspect it's to generate controversy.)

Third, the SI determines that every individual should have a child every 20 months, or 1.6 years, after reaching the age of 18 to ensure the greatest chance of a child being born. (See my comment above.)

Assuming that their are no deaths caused by accidents, catastrophes, etc., and an absolute lifespan of 80 years, and with the standard division of gender in offspring what would the population total look like in 50 and 100 years? Also, how many family pods would there be and what would the gender division of individuals that don't fit into the 1m:3f family pods look like at those year points?

Edit: Solved! Pretty much, anyway. Thanks to JBH and bendl for all their effort on this. Oh, and thanks to FreeElk for a good laugh. All three of you have been voted up.

$\endgroup$
17
  • 7
    $\begingroup$ What's a PA colony? Parents' Association? Professional Association? Party Affiliation? Placement Agency? Now to be helpful with your simulation: males and family arrangements don't count; all you have to do is simulate the females, and multiply by 1.33 at the end. (1.33 because you said there are 3 women for every man.) Note that in order to sustain the hareems of 3 women per man the "synthetic intelligence" (don't you also need an "analytic intelligence"?) must either abort 2 male fetuses out of 3 or else use artificial insemination, because otherwise the sex ratio at birth is about 1:1. $\endgroup$
    – AlexP
    Commented Dec 28, 2017 at 1:32
  • 1
    $\begingroup$ I think PA stands for Post Apocalypse, but let's let the OP clarify first. $\endgroup$
    – Vylix
    Commented Dec 28, 2017 at 2:21
  • $\begingroup$ Yes, PA stands for Post Apocalypse. I apologize for not being more clear in that. Also, I'm asking for help here because there are no "premature" deaths. All individuals live to 80. That's part of why I asked about the gender division and the pods. My friend expected there to be "floaters" who don't belong to a pod. I'm not sure what she's planning to do with them. $\endgroup$ Commented Dec 28, 2017 at 3:58
  • 4
    $\begingroup$ Uh huh, "Asking for a friend" about 3:1 ratio of women to men. I've heard that line quite a few places but never expected to hear it on world building ^^; but in all seriousness we don't care, it is a lot easier to talk directly to the writer though, whether that is you or your friend. $\endgroup$
    – FreeElk
    Commented Dec 29, 2017 at 0:08
  • 2
    $\begingroup$ your family pods will disappear after the first generation, since the gender division will even out, there may even be too many males after the first generation, since there is some evidence of a response in birth to existing sex inequality. $\endgroup$
    – John
    Commented Dec 29, 2017 at 15:18

2 Answers 2

8
$\begingroup$

This code underwent some revision due to some coding errors! See edit log for more information.


JBH has a very nice answer, and I have to admit, I mainly wrote this answer because it seemed like a nice programming puzzle.

My method: I modeled the likelihood of a woman getting pregnant after a chart I found online here. I did my best to then translate those numbers into a function of months of age since 18 years old. I ended up subtracting the $age_{in\ months}/8100$ from a starting chance of $20\%$ each month. That got me close enough to be happy. I then created a system where each person is put into a group, one of free_men, free_women or free_children. If there were enough people available, I create pods out of the free men and women groups, with priority going to the youngest people available. Each month, the women in a pod have a chance of becoming pregnant determined by their age, beginning 20 months after their last conception.

If a women dies, she is removed from the pod, if a man dies, the pod is dissolved and the women revert to the old_women group. When a child is born, they are added to the free_children group. Children born have a $51\%$ chance of being male and $49\%$ chance of being female.

The time is ticked each month and statistics about the group are displayed.

These are the statistics for the years you request:

Year 49
Free Men:  603
Free Women:  2
Free Children:  3529
Old Women:  75
Pods:  295
Number of conceptions this period:  373
Pregnancy rate:  0.33459875566803754
Number of births this period:  325
Number of deaths this period:  0
Average number of children per man:  0
Average number of children per woman:  0

Year 99
Free Men:  12617
Free Women:  1
Free Children:  73572
Old Women:  2475
Pods:  5871
Number of conceptions this period:  6801
Pregnancy rate:  0.3289336345010024
Number of births this period:  6412
Number of deaths this period:  14
Average number of children per man:  37.96969696969697
Average number of children per woman:  12.756410256410257

This makes some pretty huge assumptions, the biggest of which is that having a child has no impact on your fertility. That's clearly false. Altering the pregnancy_fertility_drop variable from 0 to 1.5 gives us these numbers:

Year 49
Free Men:  408
Free Women:  1
Free Children:  1766
Old Women:  272
Pods:  224
Number of conceptions this period:  165
Pregnancy rate:  0.312874251497006
Number of births this period:  150
Number of deaths this period:  0
Average number of children per man:  0
Average number of children per woman:  6.785714285714286

Year 99
Free Men:  5007
Free Women:  2
Free Children:  20736
Old Women:  3041
Pods:  2417
Number of conceptions this period:  1859
Pregnancy rate:  0.30061614757485816
Number of births this period:  1703
Number of deaths this period:  4
Average number of children per man:  20.451327433628318
Average number of children per woman:  6.909722222222222

Which is obviously a stunning drop (especially in the generation that is still under 18).

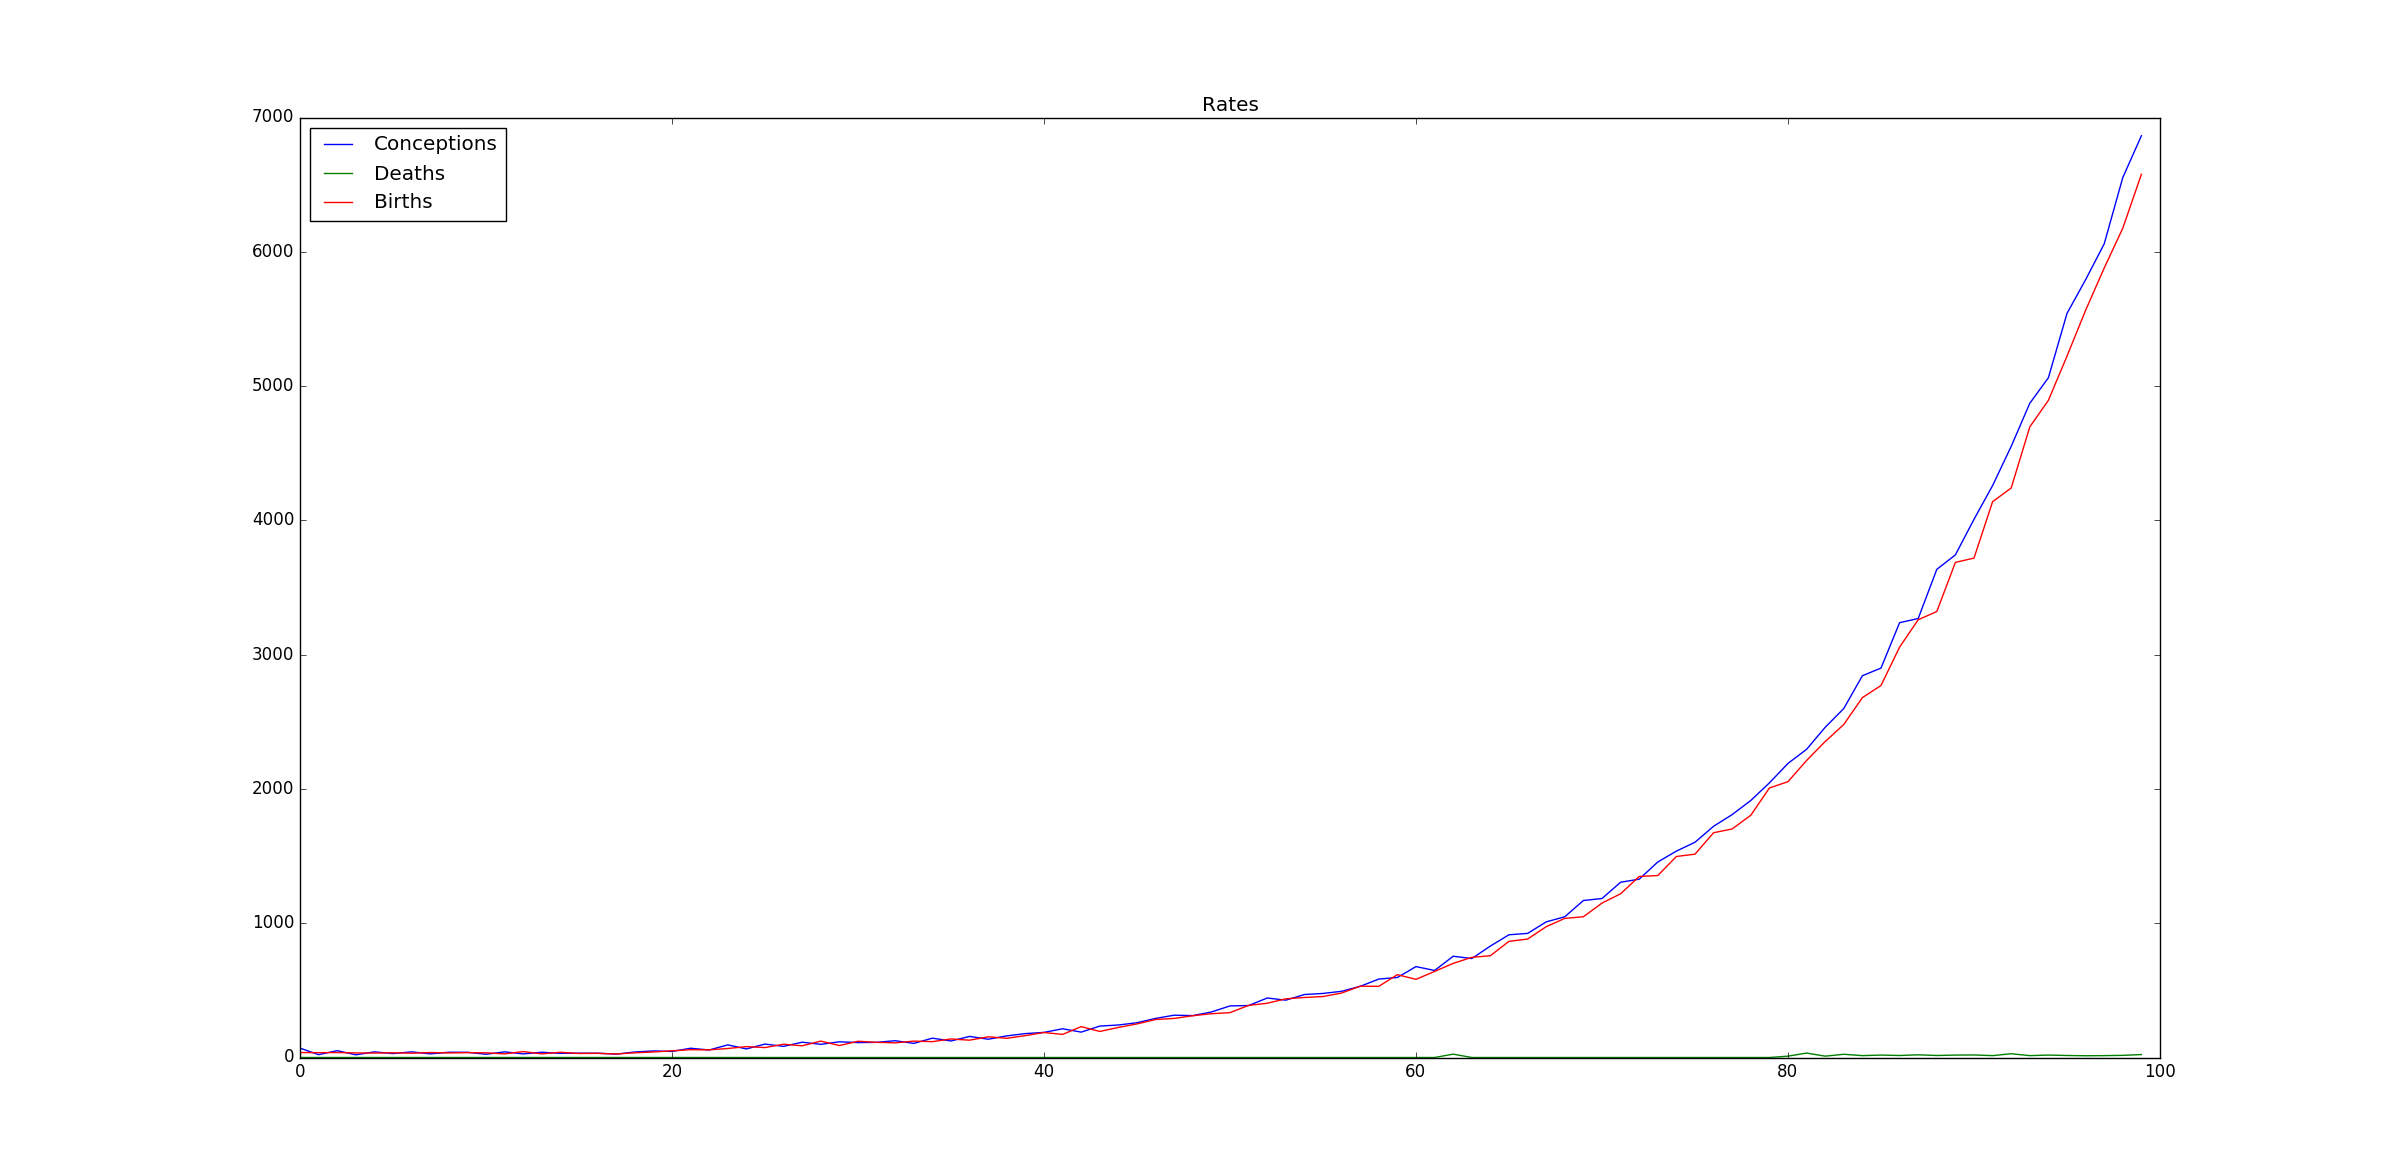
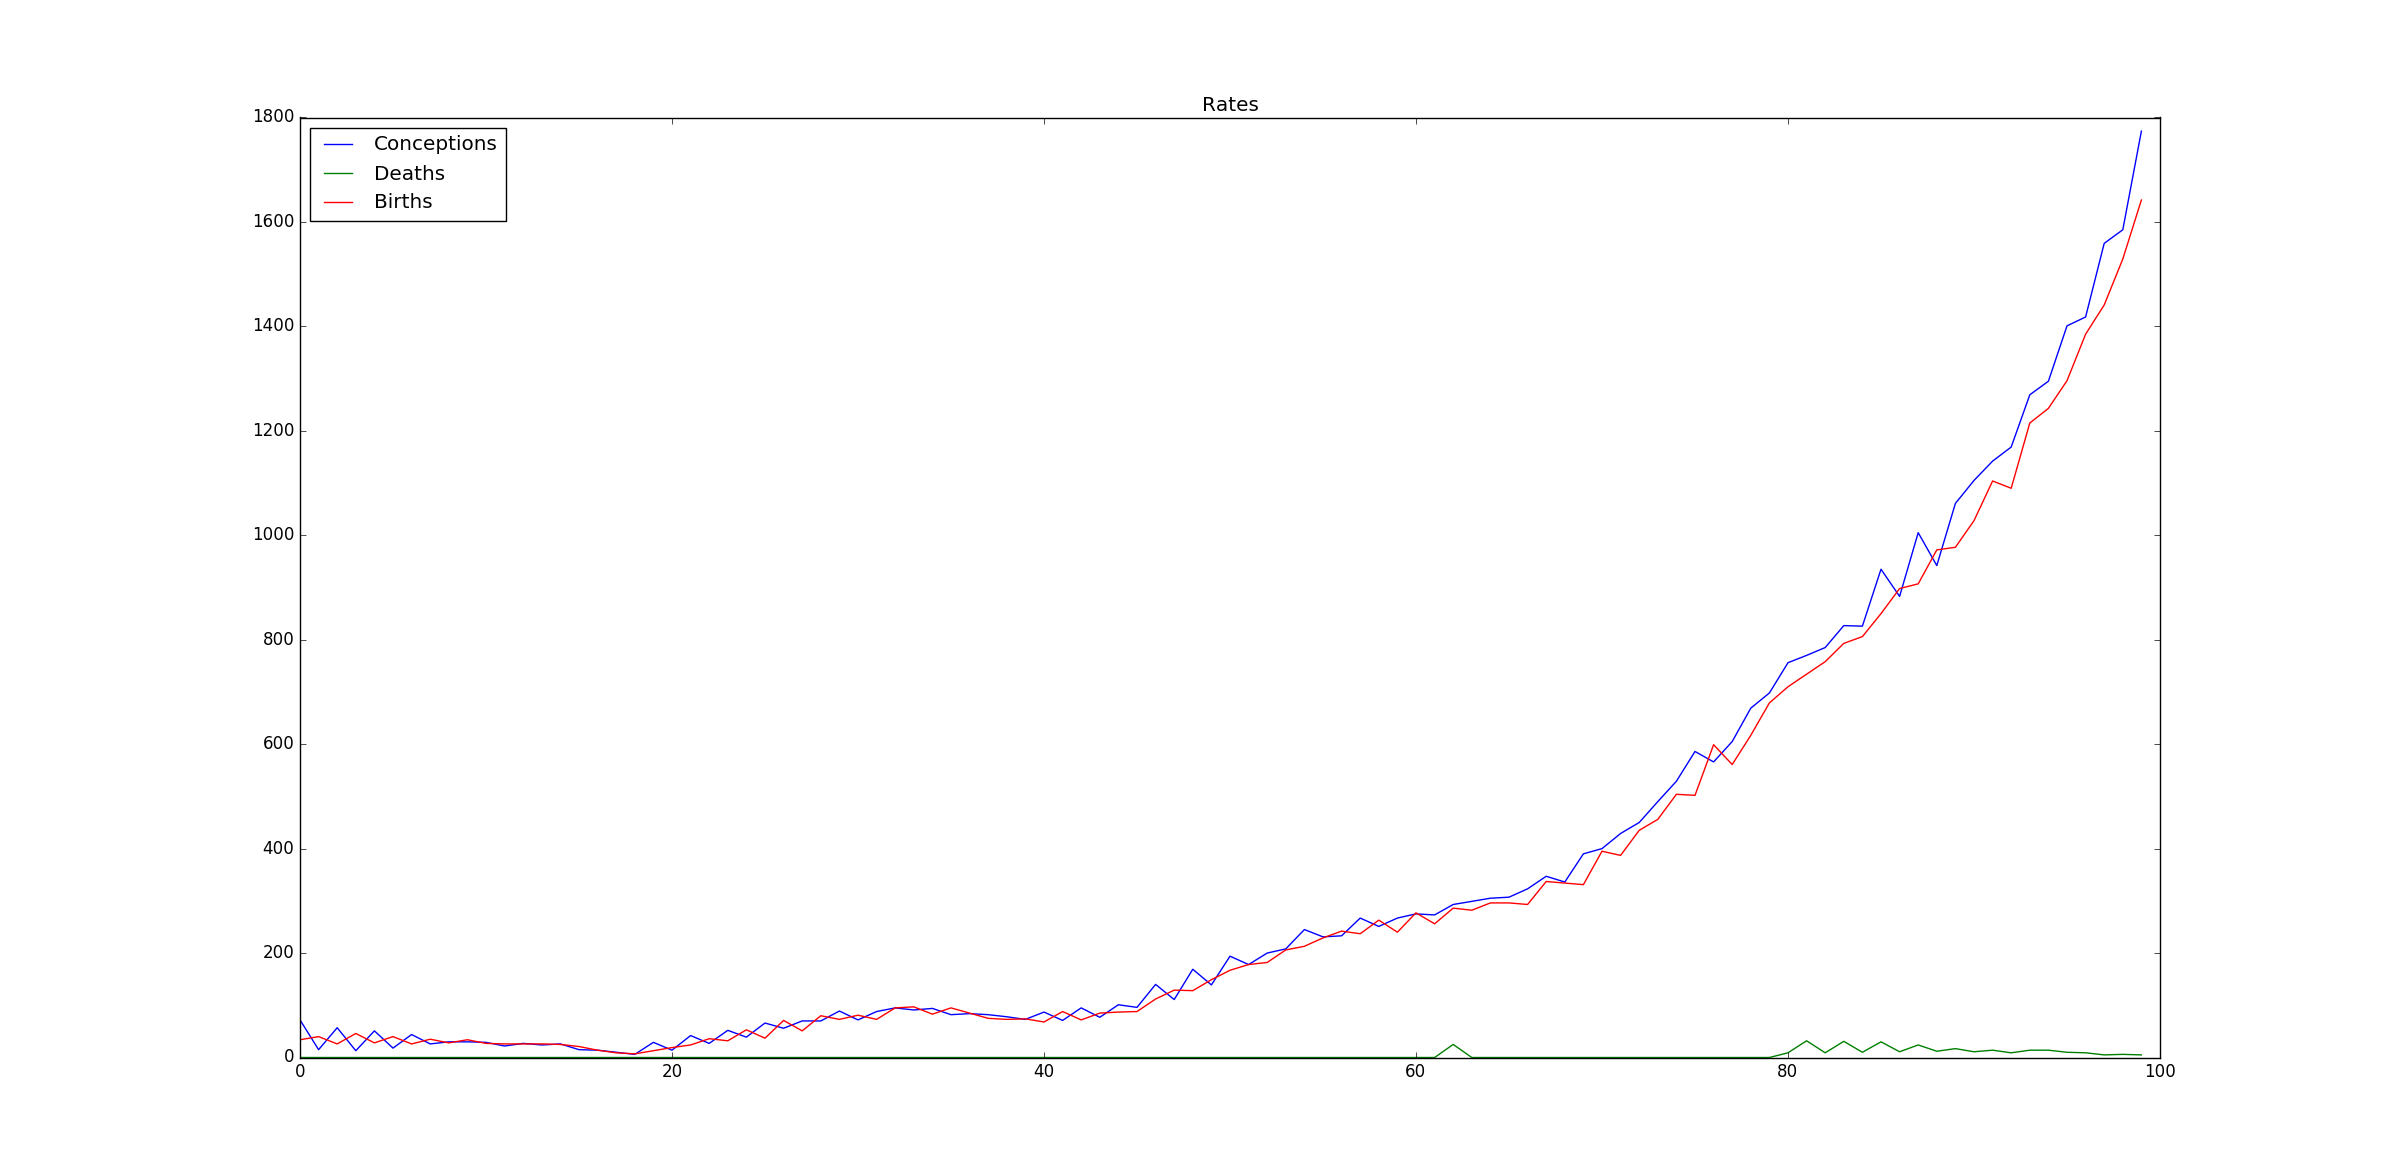
Here are some charts that show some statistics :)
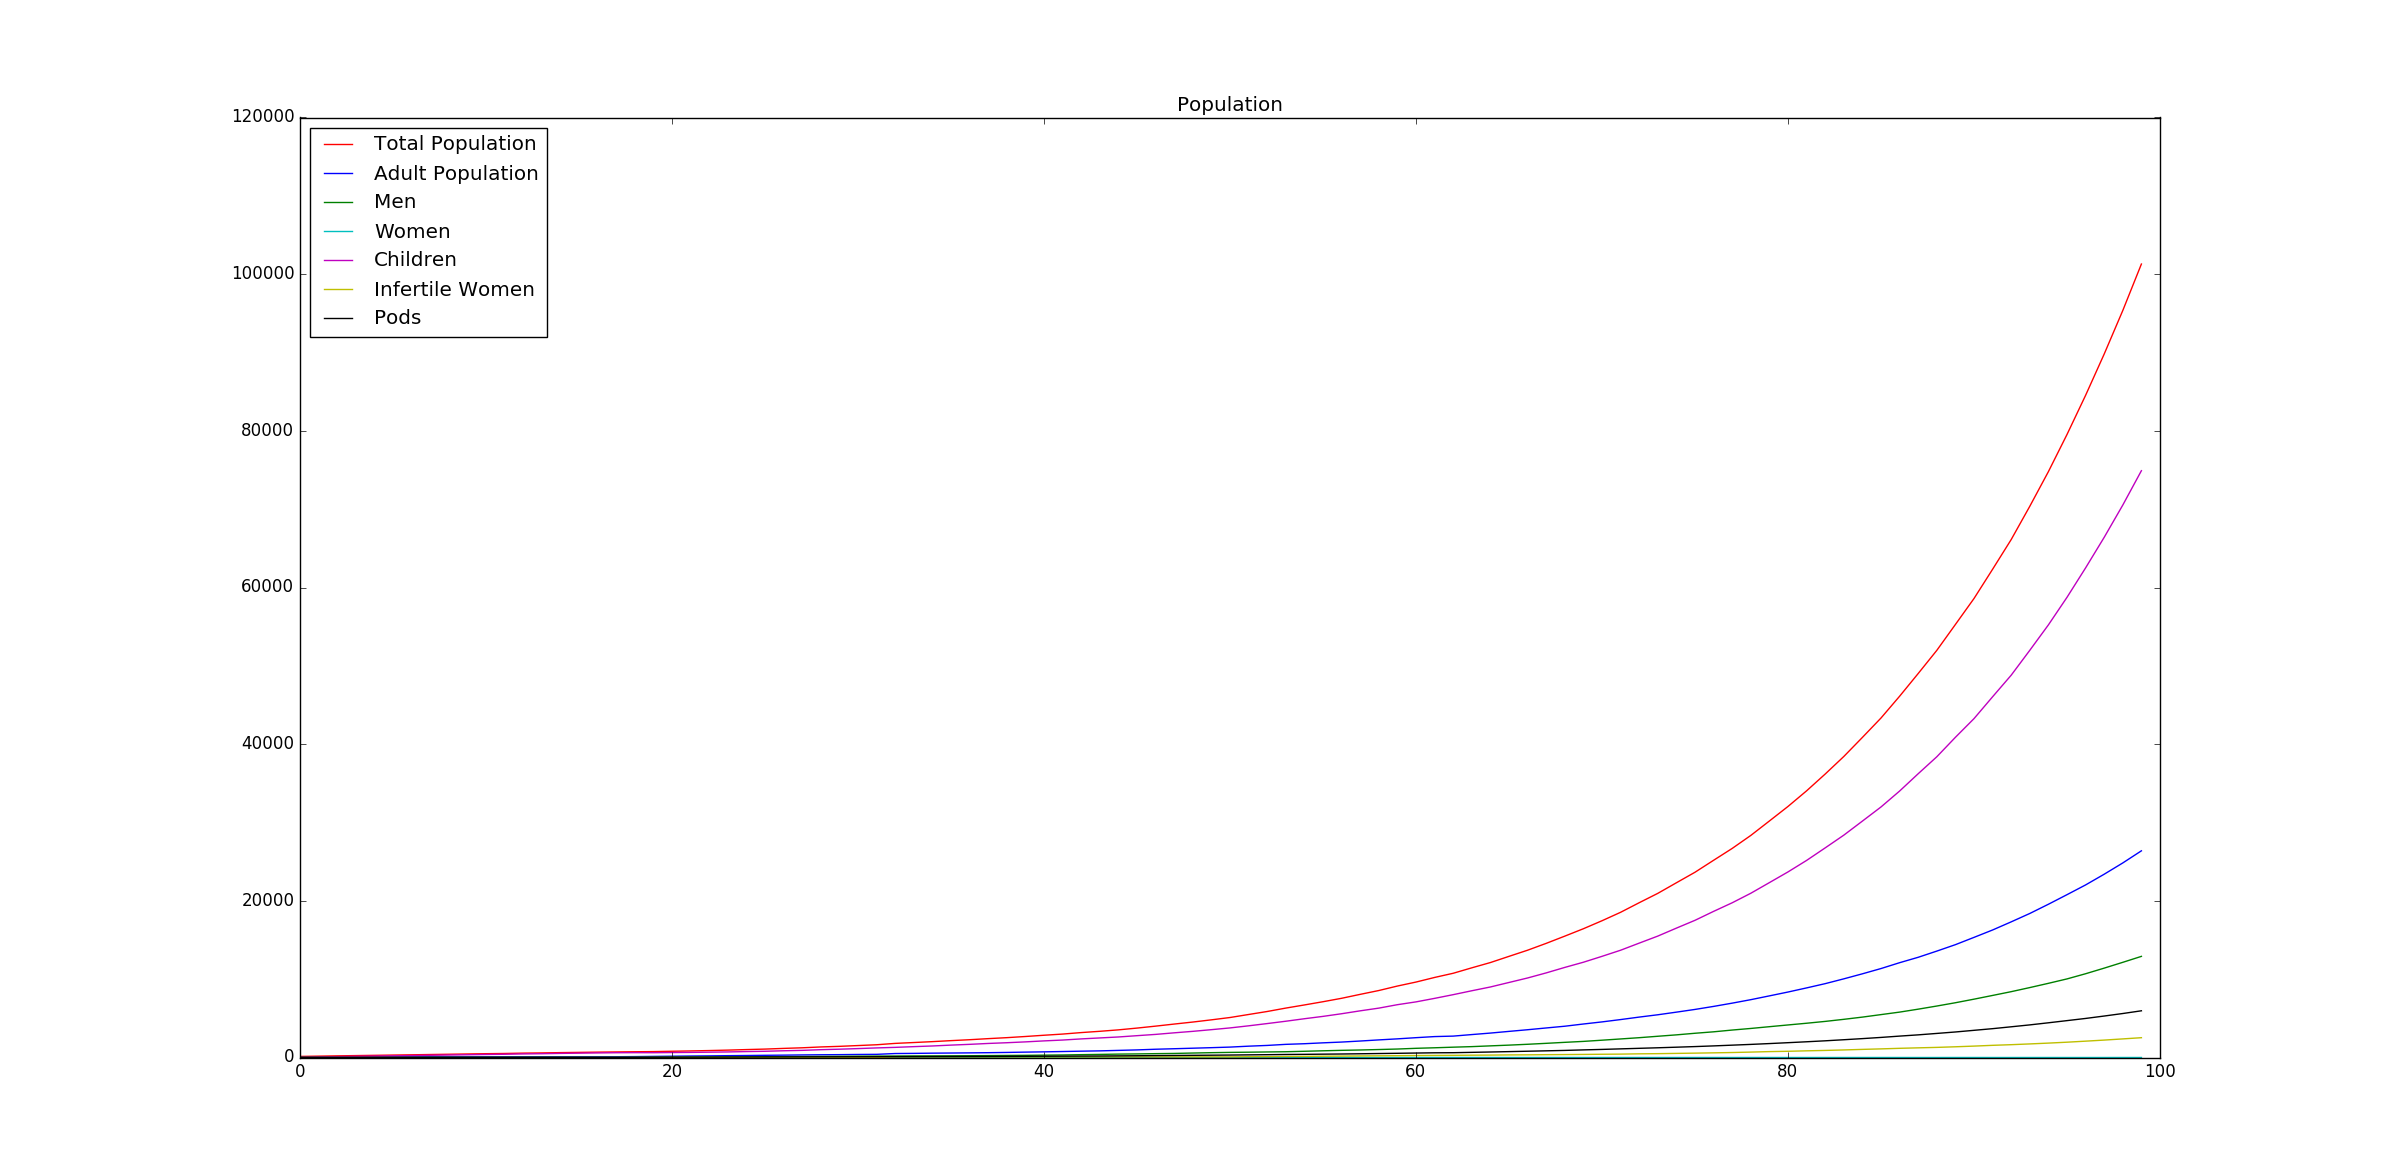
Population by year Rates by year

These aren't as interesting as the ones with the fertility drop, here they are:
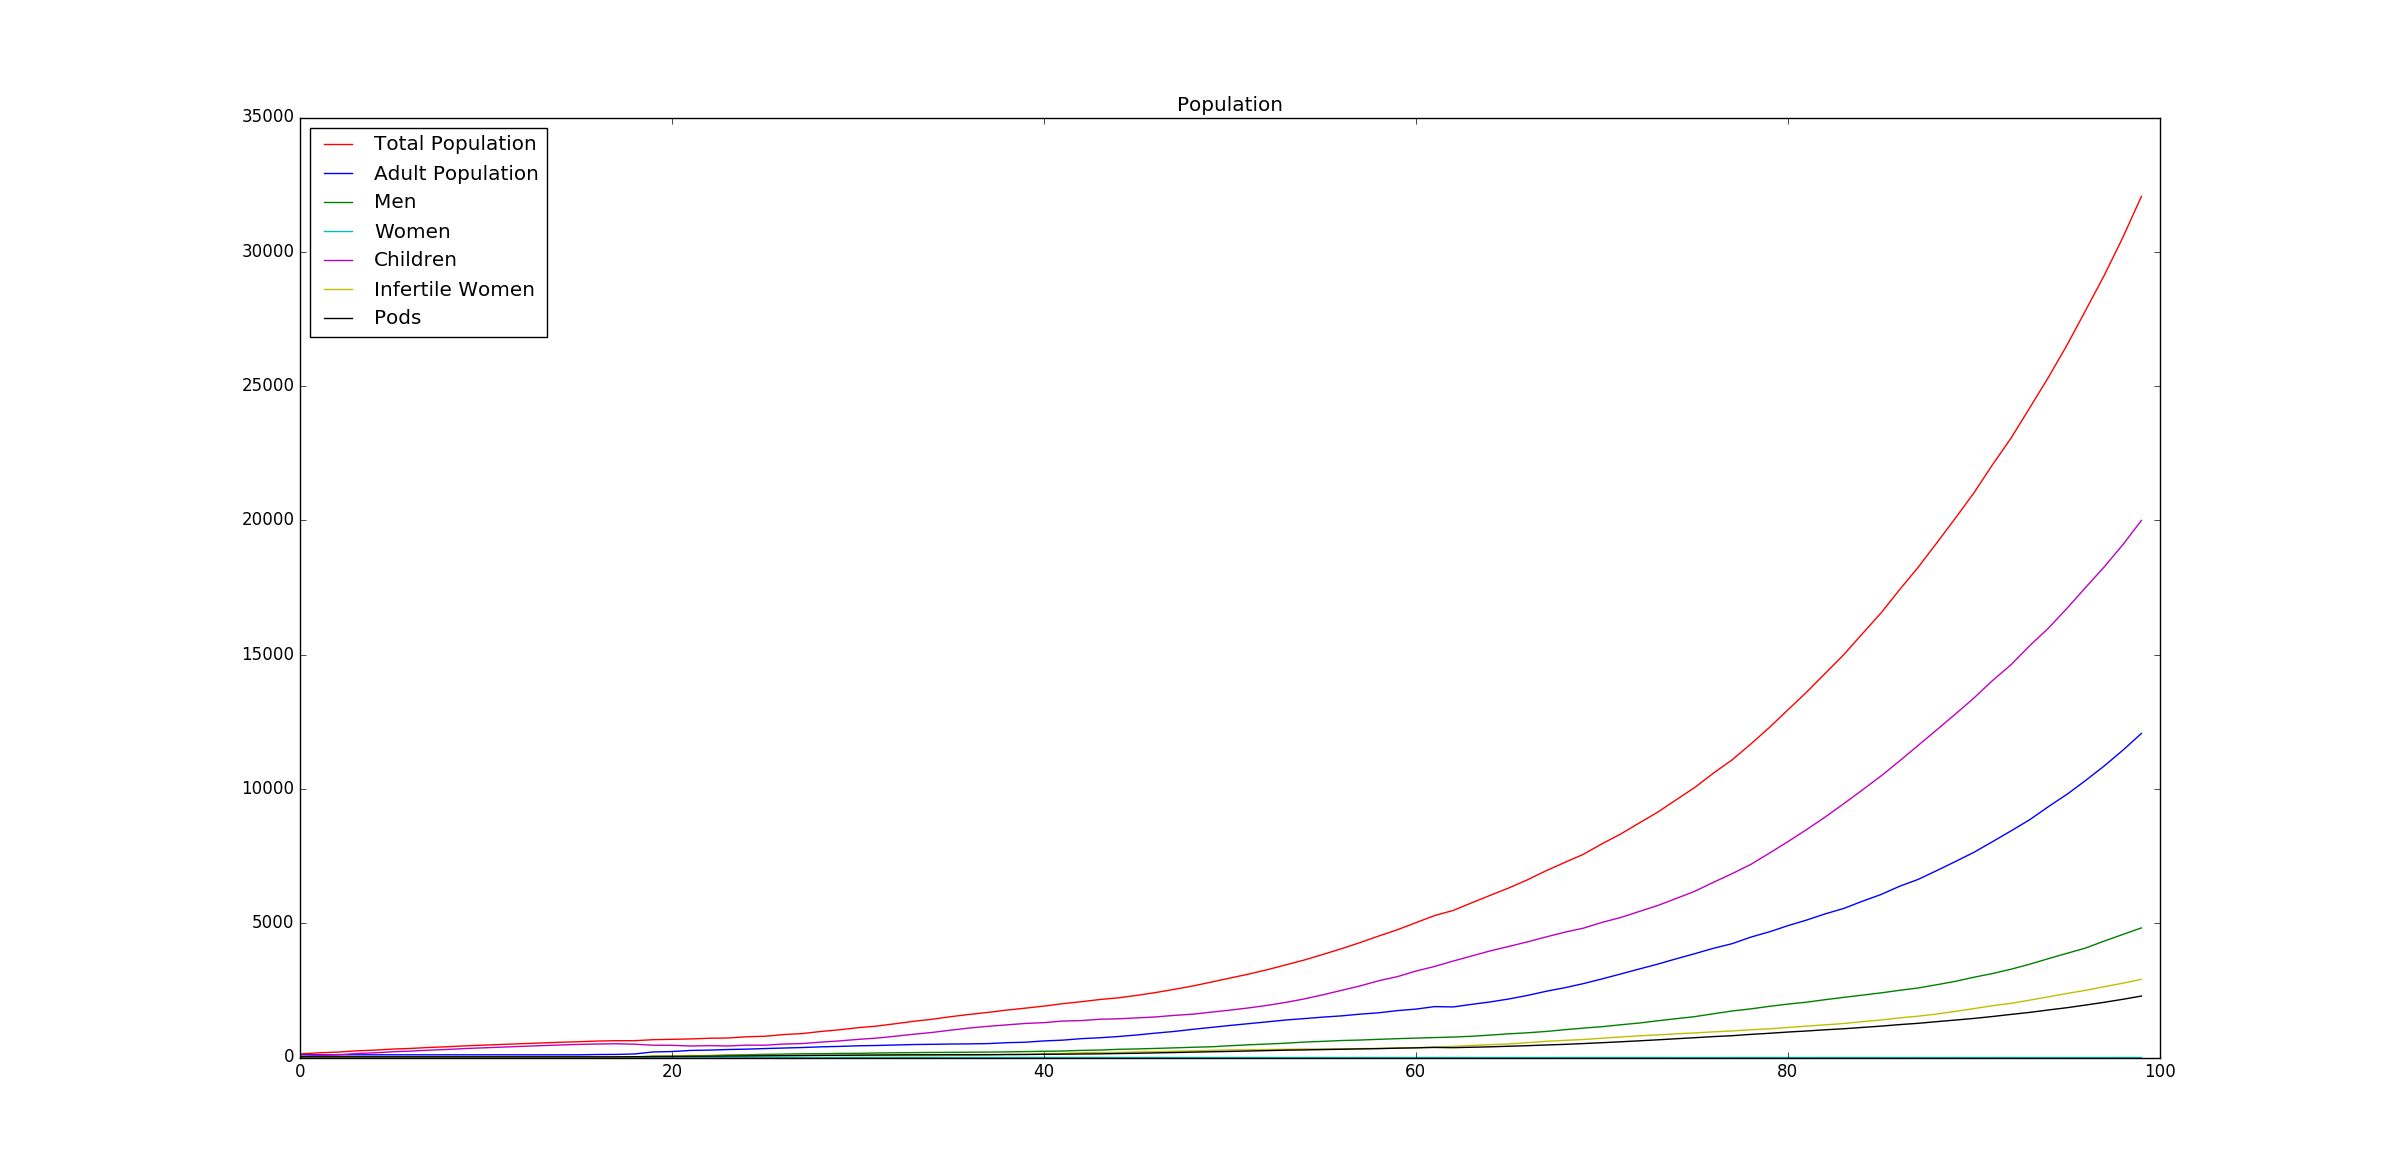
Population with fertility drop Rates with fertility drop

I find the Rates graph interesting, as you can see a significant fluctuation in fertility in 18 year increments, giving some significant generational effects!


I have the code here on Try it online!

$\endgroup$
4
  • 4
    $\begingroup$ +100000 for writing code in a real programming language :) $\endgroup$
    – kingledion
    Commented Dec 28, 2017 at 21:05
  • $\begingroup$ This is great! Thanks, so much. She's going to be thrilled with these numbers. $\endgroup$ Commented Dec 29, 2017 at 5:20
  • $\begingroup$ @MasterZoen of course! If you want to explore any of other scenarios the constants a the top of the page under the header # Constants and above # Variables that keep track of global stats can be manipulated to change the parameters of the simulation. Ask if you have any questions or you want to explore something that can't be changed using only those options! $\endgroup$
    – bendl
    Commented Dec 29, 2017 at 12:41
  • $\begingroup$ Thanks, bendl. I think that between you and JBH that I have what she'll need. I'll make sure to let her know that you guys helped so much. $\endgroup$ Commented Dec 29, 2017 at 14:48
5
$\begingroup$

Assumptions (and they're whoppers)

  • Life is perfect. Nobody dies due to accidents, disease, war, crime, suicide, genetic defect, exposure to the Star Wars Holiday Special or anything other than old age.

  • Genetic diversity is assumed.

  • We start with 75 breeding women, all starting at age 18 and reaching menopause (unspecified by the OP but assumed to be...) at 45.2 (to make the math even). Thus, every woman will bear 17 children during their 27.2 years of fertility (this is so unrealistic that I almost stopped writing, but I'll continue anyway).

  • Polygyny continues even though the ratio will eventually come close to 1:1. What this means is all women bear children regardless their sexual orientation or personal desires.

  • Realistic birth numbers are close enough to 50/50 male-vs-female that we'll use the 50/50 split. Where the split isn't even, it will always favor women.

  • The technology available to the colony is sufficient to guarantee all of the above. Considering only 100 people to start, the technology has reached the level of Clarkian Magic. (This would beg the question, "why aren't they just cloning to fix their population problems?" but we'll defer that for later.)

  • Pregnancies are perfect. Women always conceive.

Consequence: these are best case numbers. A story based in any kind of reality will result in much smaller numbers than these.

  • Year "0" is the epoch. Everyone arrives at the new colony and they breed like rabbits.
  • Year 0.75 is the first batch of children with a new batch for every woman of child-bearing years thereafter every 1.6 years.
  • The PHP program I wrote to calculate this is listed below.
  • The years aren't even (50 & 100) because you start 9 months after arrival (year 0.75) and advance every 1.6 years, neither number nor their sum being divisible by 10....

Year: 48.75

  • Women: 4,282
  • Men: 4,180
  • Total: 8,462

Year: 99.95

  • Women: 143,768
  • Men: 136,210
  • Total: 279,978

This is so utterly unrealistic that it's making angels weep. Few women can have 17 children in their lifetime, and of those who can, I'd bet almost none want 17 children. Add to that the fact that people die... a lot... and I'd bet reality is less than 10% of these results. In fact, it might be less than 5% of these results.

<?php
$men = array(array('number'=>25, 'age'=>18.75));
$women = array(array('number'=>75, 'age'=>18.75));
for($year=0.75; $year<=100; $year+=1.6){
    foreach($women as $key => $val){
            if($women[$key]['age']>80){$women[$key]['number']=0;}
            if($men[$key]['age']>80){$men[$key]['number']=0;}
            if($women[$key]['age']>=18.75 && $women[$key]['age']<=45.95){
                    $dwomen = round($women[$key]['number']/2);
                    $dmen = $women[$key]['number']-$dwomen;
                    array_push($women, array('number'=>$dwomen, 'age'=>0));
                    array_push($men, array('number'=>$dmen, 'age'=>0));
            }
            $women[$key]['age'] += 1.6;
            $men[$key]['age'] += 1.6;
    }
    $twomen = 0;
    $tmen = 0;
    $total = 0;
    foreach($women as $key => $val){
            $twomen += $women[$key]['number'];
            $tmen += $men[$key]['number'];
            $total = $twomen + $tmen;
    }
    echo "Year:\t".$year.", Women:\t".$twomen.", Men:\t".$tmen.", Total:\t".$total."<br>";
}
?>

I'm going to leave it as an exercise for the OP to modify the code or analyze the code's data to answer his last couple of questions. However, unless your SI genetically enforces the 1:3 relationship, you lose it very, very quickly. Your year 100 ratio is 49:51, which is very close to normal.

$\endgroup$
9
  • 1
    $\begingroup$ +5 for writing code and not just hand-jamming the answer! $\endgroup$ Commented Dec 28, 2017 at 14:33
  • 7
    $\begingroup$ -5 for choosing PHP to write the code $\endgroup$
    – bendl
    Commented Dec 28, 2017 at 15:55
  • 1
    $\begingroup$ If life expectancy is the same, how can there be 7,000 more women than men after 100 years? You started with only 50 more women then men, and you are assuming a 50/50 birth split. Something about your algorithm must be off. $\endgroup$
    – kingledion
    Commented Dec 28, 2017 at 21:08
  • $\begingroup$ That bit about the SW holiday special is the most unrealistic assumption of these. $\endgroup$
    – DonielF
    Commented Dec 29, 2017 at 0:36
  • 1
    $\begingroup$ Since my numbers ended up matching surprisingly well, I'd say his algorithm is alright $\endgroup$
    – bendl
    Commented Dec 29, 2017 at 2:30

You must log in to answer this question.

Not the answer you're looking for? Browse other questions tagged .