32
$\begingroup$

This Query is part of the Worldbuilding Resources Article.


This question is a sort of follow-up to Samuel's previous world map question, Creating a realistic world(s) map - planetary systems.

Lots of science fiction stories involve journeying to nearby stars. Many involve the first human explorers setting out for a new star system. It's easy to pick from the stars near the Solar System. For stories set in other star systems, however, creating a realistic stellar neighborhood can be difficult.

What, in general, determines how close stars are to one another in any given area of a galaxy (or globular cluster)? What are the typical number densities in various regions?

Also, what is a typical distribution of star types in a given area? I'm aware of things like the initial mass function, which can be very helpful, but some stars may be born together and stay together for a short while, which includes the possibility that they may be similar. Chances are low that, after a long time, all the stars in a given area will be alike, admittedly.

This is a question. I haven't looked into the subject in detail, but I would assume that we have some decent data on at least some of the factors given here. There should be enough reputable research to put together into a good, solid, hard science answer.


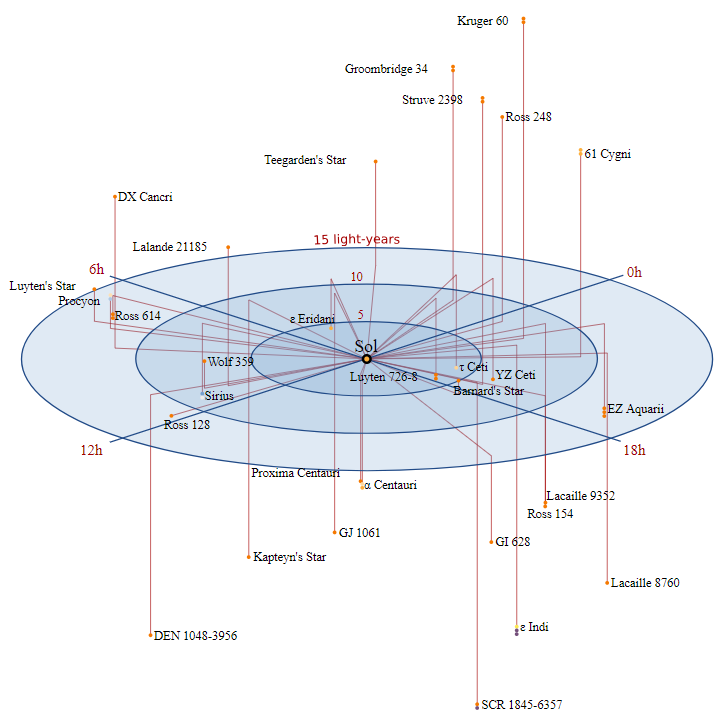
Here's a representations of the local stellar neighborhood, to give you an idea of what the stars surrounding the Solar System are like:

enter image description here
Image in the public domain.

$\endgroup$
11
  • 1
    $\begingroup$ The pictures are really misleading. I had to reread the question to understand what was really being asked.... For some reason I had interpreted the images as part of the question, confusing me into thinking that the question had something to do with how the map was supposed to be displayed, which could've made it a dupe of this $\endgroup$
    – Aify
    Commented Aug 20, 2015 at 19:32
  • $\begingroup$ @Aify Sorry, I can do some re-arranging. $\endgroup$
    – HDE 226868
    Commented Aug 20, 2015 at 19:33
  • $\begingroup$ That would be very nice of you to do :) $\endgroup$
    – Aify
    Commented Aug 20, 2015 at 19:33
  • $\begingroup$ @Aify Done, with a partition. Is that a bit better? $\endgroup$
    – HDE 226868
    Commented Aug 20, 2015 at 19:34
  • 1
    $\begingroup$ I think this is hard to answer - partly the problem is the hard science tag raising the barrier for entry but also it's really a very broad question. Neighbours will vary a lot depending on location in galaxy/cluster/whatever. Age of stars, age of galaxy, etc $\endgroup$
    – Tim B
    Commented Sep 4, 2015 at 20:51

5 Answers 5

16
+200
$\begingroup$

Someone's done that...

In the collection Writing Science Fiction, the John Barnes essay How to Build a Future includes plotting out a star map, using the distribution and distances to inspire the plot.

The map immediately drew my attention to ... Though they exchange easily among themselves, they are quite remote from the hub. ... suggests really deviant subcultures could grow there.

Reviewing it to cite for this Answer, I discover that the star positions are the real neighborhood around Sol, rather than making up a distribution. He does suggest making a distance travel matrix "not unlike the milage charts found in road atlases".

Find the real map of the Milky Way

For a neighborhood of stars not immediately around us, maps actually do exist now. SDSS comes to mind, "first data released by the SDSS-III's Apache Point Observatory Galactic Evolution Experiment (APOGEE), an effort to create a comprehensive census of our Milky Way galaxy."

A careful Google search turns up interesting papers on how stars move around after they are born and details of our spiral arm structure, and a Chrome browser app that is an interactive 3D map of 100,000 stars.

The Gaia observations are in progress, and RAVE has details of half a million stars.

Neighborhood Demographics... IN SPAAACE!

The density of stars varies from the center to the edge, and is the cause of the spiral arms so you have substantial density variation at a given radius, too. You really should be asking on Astronomy SE for where to get a map or table of stellar density values.

The Distributions of star types is answered here in Physics.SE. It references a chart of Fraction of all main-sequence stars that you can use as a first approximation. Note that for a typical steady-as-she-goes neighborhood, the stars do get mixed up after being formed (as discussed above). After a few billion years when the solar system has settled down, the star will be distributed within the galaxy and long separated from its birth cluster. However, super giant stars burn fast and die young, so are only found near their places of birth. Remove these from your statistics.

Meanwhile, red dwarfs and newly-classified infrared dwarfs are hard to see at any distance but the most abundant. So sprinkle liberally in your synthetic map. Likewise, brown dwarfs and rouge worlds outnumber starts but are mostly uncharted.

You should also know about "Population I" and "Population II" stars, since they represent different regions of the galaxy and they differ in detail because they formed in different generations out of different material.


Practical Advice

To create your artificial neighborhood map, you have quite a bit of freedom in density. There is really no lower bound since the density tapers off above the plane. There are no (non-open) clusters within the body of the disc as it gets torn apart as it orbits the galaxy, but you can plausibly have a knot of denser than normal in an arm, and push the limits of the normal statistics for such things. The spiral arms are really just traffic jams.

You should worry more about avoiding mistakes that can be noticed (like a star that's the wrong age, or unstable trinary systems) than about getting the density exactly right.

And that reminds me, you should also include the right proportion of binary stars to singletons, and the occasional more exotic bound system. The more exotic situations will be affected by density: a hierarchical binary of 4 stars needs enough room.

$\endgroup$
4
  • $\begingroup$ Thanks for the answer and research. I was aware of the density models (I'd looked at quite a few galactic tomography papers from SSDS). Can you explain why the density distribution behaves as it does? $\endgroup$
    – HDE 226868
    Commented Sep 10, 2015 at 22:23
  • 1
    $\begingroup$ Different features have different origins. (1) Flattened disk shape, (2) radial function, (3) spiral arms. I've seen a video that shows the natural emergence of spiral arms due to slight eccentricity of each orbit. Being a dense region, it behaves like a traffic jam: stars accelerate up to it and a held back from leaving it, because the denser region attracts. So any clump once formed will persist, moving with its own velocity in either direction superimposed on the main traffic. $\endgroup$
    – JDługosz
    Commented Sep 11, 2015 at 1:17
  • $\begingroup$ "What explains the density" is a question for Physics or Space or Astronomy SE, and off-topic here. $\endgroup$
    – JDługosz
    Commented Sep 11, 2015 at 1:24
  • $\begingroup$ Okay, thanks, those clarifications help quite a lot. I do think that "What explains the density" is on topic here; it is inline with a lot of the other Creating a Realistic Worldmap questions. $\endgroup$
    – HDE 226868
    Commented Sep 11, 2015 at 1:26
5
$\begingroup$

Start with the required materials on the home world then work out the details from there. What follows is an anthrocentric answer that assumes the author wants to make a stellar map for exploration by humanoids.

Notes and Assumptions:

  • The term "astro-metal" means all elements heavier than hydrogen and helium. The term "chemical-metal" refers to the normal definition of a metal.

  • If the explorers are leaving from their home world then it's safe to assume that the local neighborhood is calm and orderly. On earth, it took about 3.6 billion years to develop a space fairing species. Even under "optimal" conditions, developing a space fairing species is going to take billions of years. This kind of stability isn't possible if a large nearby star goes novae or supernova nearby or another star comes close enough to disrupt planetary orbits. This implies that the trajectories of the stars in the local neighborhood are all going the same direction.

  • That a astro-metal rich star (metal rich in the astronomical sense, not the chemical sense) will lead to chemical-metal rich world for the explorers to explore.

  • This answer assumes these explorers started from the same kind of environment as life on Earth.

Important Questions to Answer

What kind of materials do you need on your home world for your explorers to use? Do you want/need large quantities of heavier elements compared to earth?

  • If so, then that implies a specific history about your local neighborhood. Greater abundance of useful minerals such as iron, uranium, thorium etc come from supernova events. If the neighborhood lacks heavier elements then there may not be enough material to form rocky planets for life to form on. Further, if the explorer's home planet lacks easily accessible metals then building the economy required to build space ships isn't possible.

How dense is the local neighborhood?

  • How far do you want these first explorers to go when they start out? 1 star per cubic light year? 1 star per 10 cubic light years? Earth's nearest neighbor is Alpha Centauri at 4.37 light years. The further out a neighborhood is, the lesser stellar density can be expected.

    ...In the solar neighborhood, the stellar density is about one star per cubic parsec (one parsec is 3.26 light-years). At the Galactic core, around 100 parsecs from the Galactic center, the stellar density has risen to 100 per cubic parsec, crowded together because of gravity.

*How old are the local stars?**

  • Star age is directly related to how big and bright they are. Larger stars burn out more quickly than smaller stars and thus are less likely to support life. Equations to describe a star's life time in relation to mass can be found here (pdf, page 7). These same equations determine how bright a star is. A stellar group composed of large stars between 8 and 40-50 solar masses will generate Type II supernova (and that will really ruin a planet's day). Thus, the local neighborhood needs to have stars below a certain mass.

  • A survey of star ages in Sol's neighborhood shows several very young stars hundreds of megayears old and a collection of stars with ages similar to or longer than Sol's. Keep in mind that the ultimate age limit of any star is 13.82 billion years, or the age of the universe. (Though sometimes, weird stuff happens.)

Need for constellations?

  • The author may need or want something in the sky to motivate the exploers to get going. Perhaps an especially meaningful constellation or an extra bright star that serves to inspire a species to "Get Out There->"

Drawing the Map

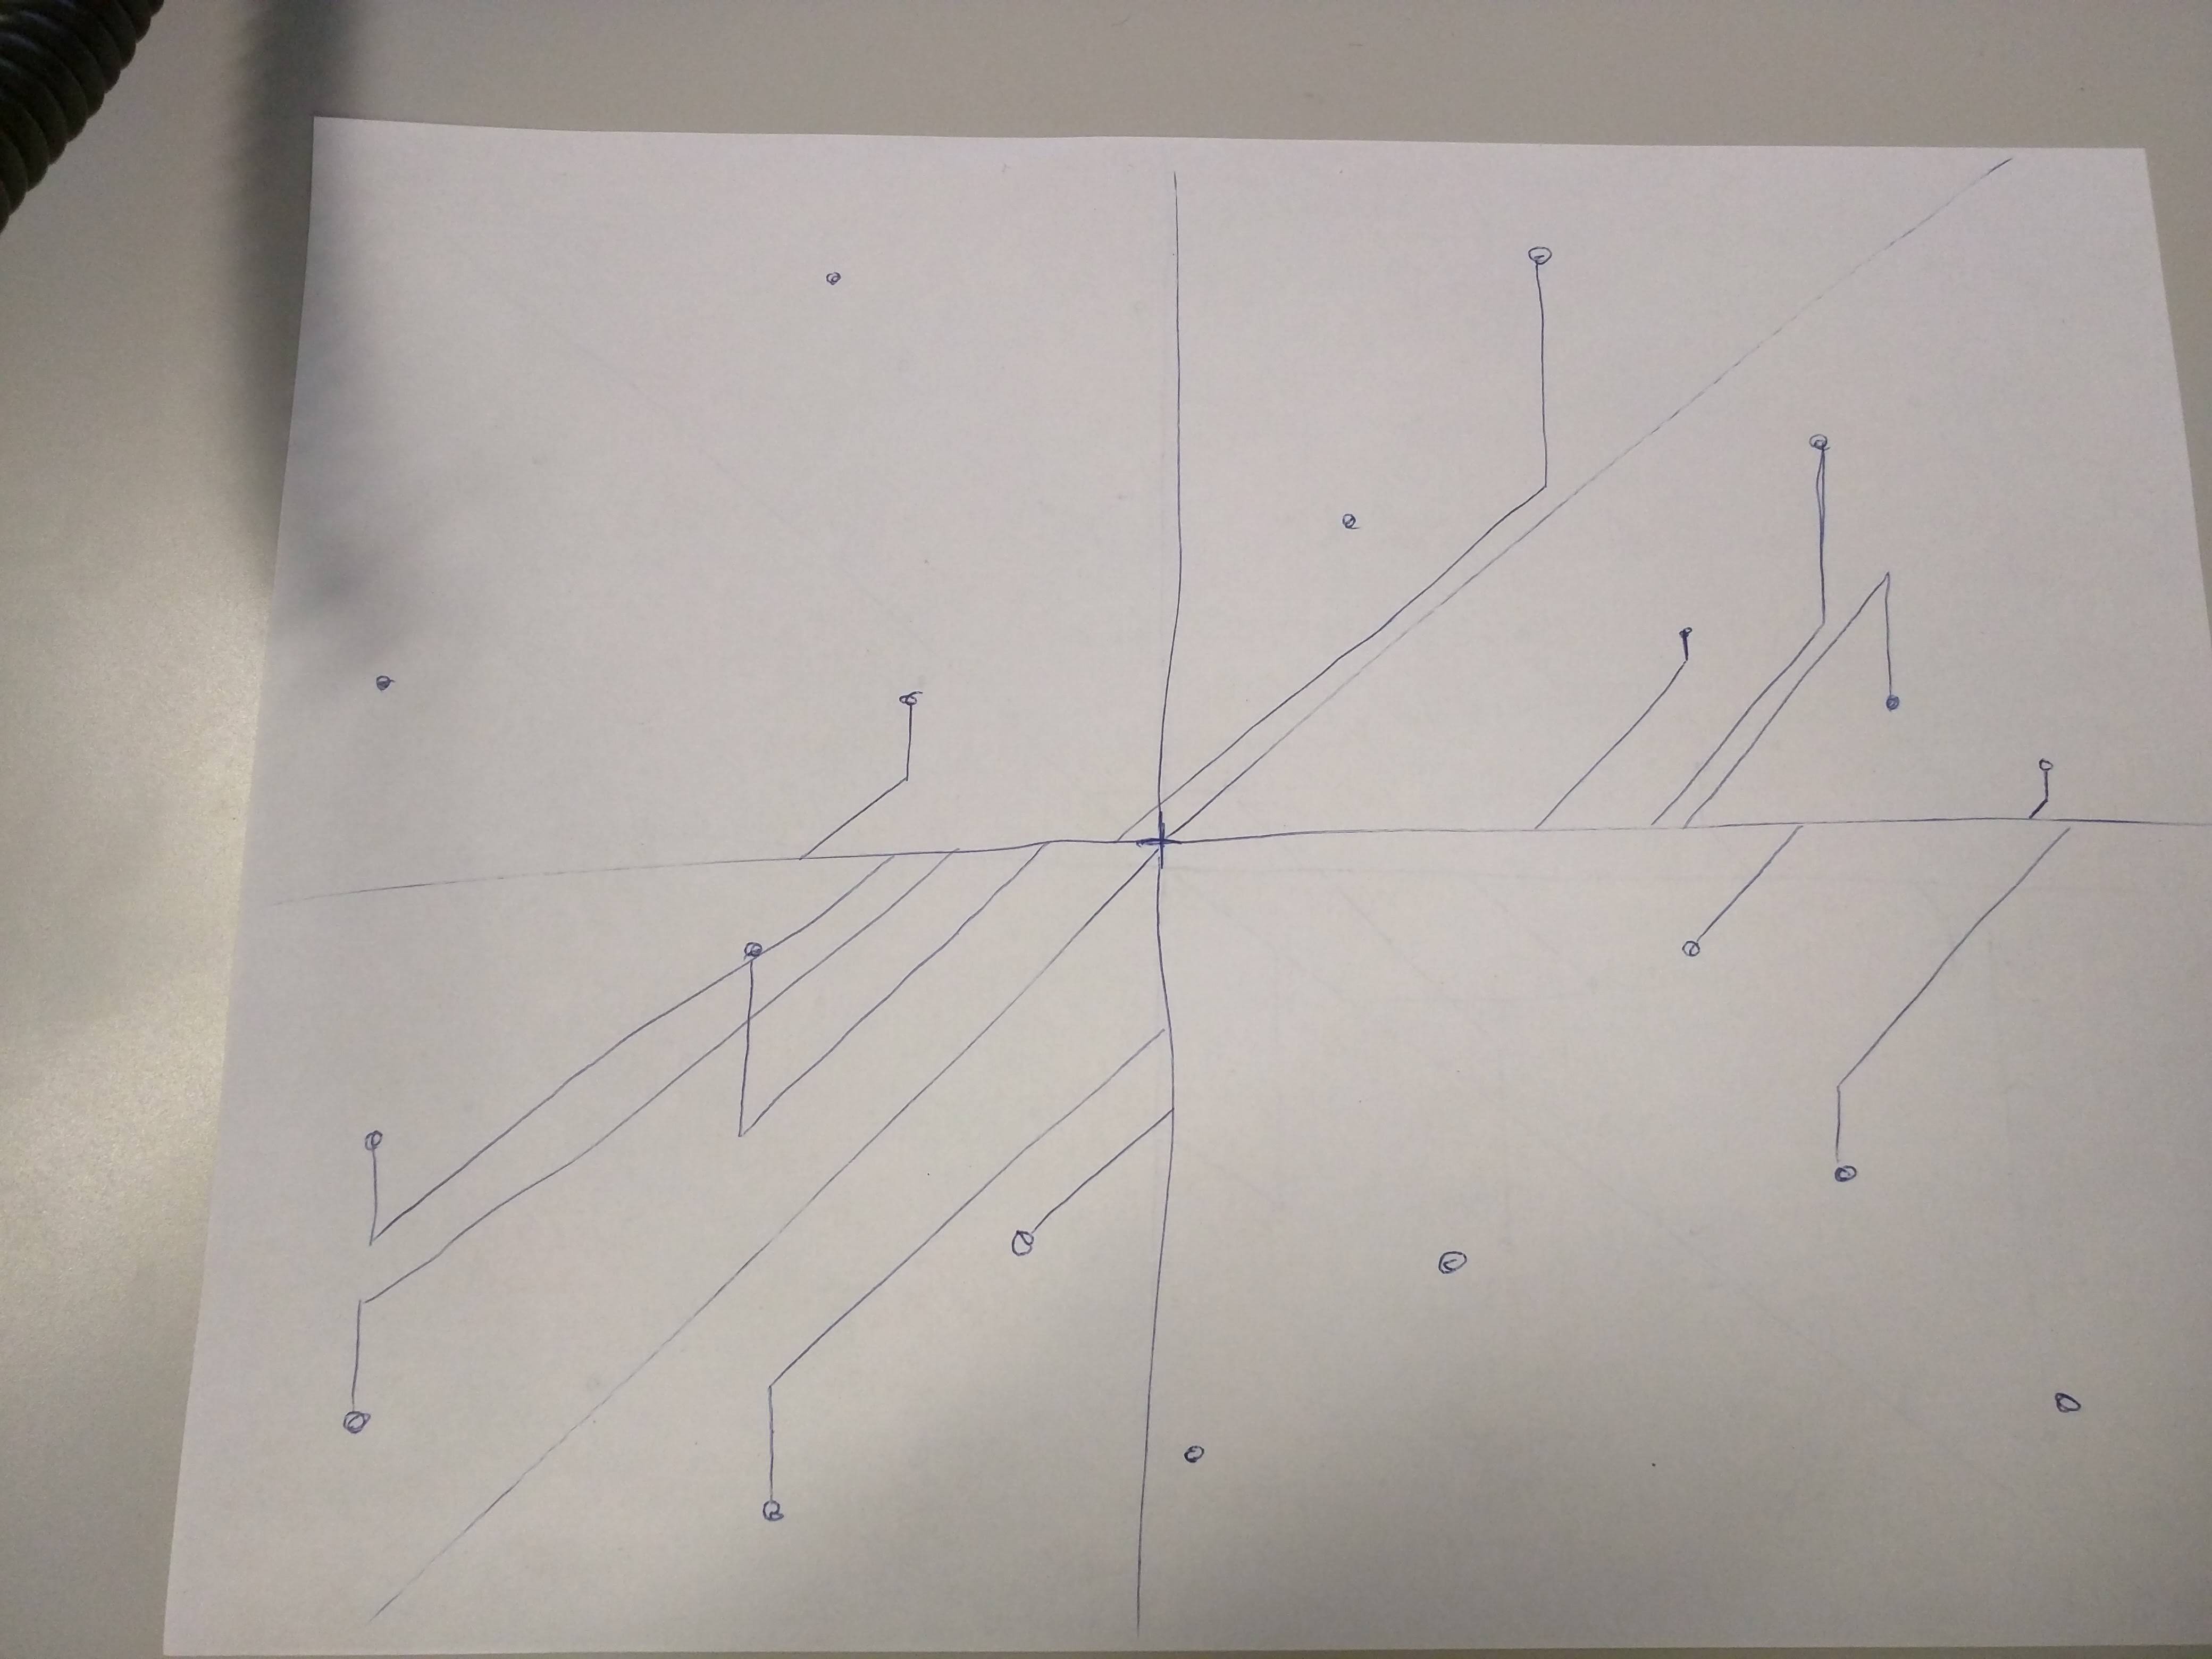
  1. Grab a piece of paper and a pen. Draw a small cross in the center of the page. Also draw horizontal and vertical lines that bisect the page to form the X and Y axii. Draw a diagonal line at 45 degrees to horizontal to form the Z axis.

  2. Drop 20 to 30 dots on the paper. If you desire a denser stellar neighborhood, either adjust the scale or add more dots.

  3. Draw diagonal and vertical lines to establish whether a star is above or below the stellar plane. Care must be taken when drawing these lines as they fix the stellar distribution. Ensure that each of the 8 quadrants have roughly the same number of stars to avoid gravitational imbalances that may need to be explained later. This is also the stage where the author may make any special placements to drive plot or add flavor to the star map.

Complete Star Map

  1. If desired, draw in a legend for distances. Add star names or region names. As much details as the author desires can be added.

  2. If desired, a polar coordinate star map (as show in the OP) may be drawn. Also, projection of the star map from the surface can be developed too (though to do so is beyond the skill of this poster.)

Possible Plot Angles

  • If the explorer's home world is significantly different than the surrounding stars, say the home star has 3x the metalicity of its neighbors then that will be an interesting thing to investigate....because ALIENS!
  • If their home world is astro-metal poor but a nearby star is comparatively astro-metal rich then that might serve as a good motivator to build generation ships to move a significant chunk of the population to the "greener grass" of the metal rich star.
  • If the local neighborhood is rapidly aging then it may motivate the explorers to start moving out of the local group. Again, more generation ships.
$\endgroup$
6
  • 1
    $\begingroup$ Nice answer. I'd like to see some information on what sort of stellar density should be expected where though and the distributions of types of stars. $\endgroup$
    – Tim B
    Commented Sep 14, 2015 at 14:32
  • $\begingroup$ Like, stellar density is smaller the further from the galactic core you go? $\endgroup$
    – Green
    Commented Sep 14, 2015 at 14:34
  • $\begingroup$ Yes. But also (preferably sourced) figures for what sort of densities to expect. i.e. how many stars you should see at what distances. $\endgroup$
    – Tim B
    Commented Sep 14, 2015 at 14:34
  • $\begingroup$ Will starting from a uniform random (ish) distribution of the 2d projection give you a random distribution in 3d? IAC, he was asking about realism of the neighborhood (not how to draw it) and your answer to that is "just throw some dots down". What's the average distance? What's the type of each star for a realistic situation? This does not answer the question. $\endgroup$
    – JDługosz
    Commented Sep 14, 2015 at 14:38
  • $\begingroup$ @JDługosz, I've added some additional information about star age, luminosity and mass; along with some requirements for the size of local stars. I'm waiting on HDE to see if he finds the "how to draw" portion useful or not. $\endgroup$
    – Green
    Commented Sep 14, 2015 at 15:32
5
$\begingroup$

I decided to start answering this question by building a galaxy (well, a model of a galaxy, but it sounds cooler the first way). A lot of research has already been done in this area, specifically, in density wave theory, which explains the winding arms of spiral galaxies. Before we begin, here’s your 60-second introduction to the structure of spiral galaxies.

A spiral galaxy can be thought of as a conglomerate of three separate structures:

  • The galactic disk, the flattened section of the galaxy lying on the galactic plane. It is in turn composed of the thin disk and the thick disk, containing relatively younger and older stars, respectively. The disk also contains spiral arms.
  • The galactic bulge, a dense region in the center of the galaxy which extends further out of the galactic plane than the galactic disk does.
  • The galactic halo, a roughly spherical set of stars, gas, globular clusters, and dark matter than surrounds the galaxy. The stellar component of this can be found in the galactic spheroid. The halo has, on average, a lower mean density of gas and stars, though it is rich in dark matter.

Now we can construct a model of a spiral galaxy, starting with a gravitational potential denoted by $\Phi(R,\theta,z,t)$, where $R$ is the radius along the plane, $\theta$ is the azimuthal angle, $z$ is the vertical distance above the plane, and $t$ is time. We’re working in cylindrical coordinates, but we’re also taking time into account. Over hundreds of millions of years, spiral galaxies rotate, and stars move in and out of dense and not-so-dense regions. I’m not going to display any results like this because my Mathematica skills are currently limited, but it’s not too hard to do.

We could choose a rather simple model for our galaxy. Power law radial density models are the simplest, where the density in the plane is $$\rho(R)=\rho_0\left(\frac{R}{R_0}\right)^{-\alpha}\tag{1}$$ where $R_0$ is a reference radius and $\alpha$ is an real number. $\alpha=2$ fits many observed rotation curves, to a decent degree of accuracy. Adding in the $z$-component is then simple; this is just multiplied by one of two possible factors: $$\exp\left(\frac{-z^2}{z_0^2}\right)\quad\text{or}\quad\text{sech}^2\left(\frac{z}{z_0}\right)\tag{2a, 2b}$$ with scale height height $z_0$. This seems simple enough, and the corresponding potential can be calculated without too much trouble. However, current data has led to better models using a sort of exponentially decreasing radial fit for the galactic potential.

I’m strongly basing my choice here on information I gathered in this answer, using data from Antoja et al. (2011). Their equation for the potential is of the form $$\Phi(R,\theta,t)=\sum_mA_m(R)\cos(m\theta-m\theta_0-\phi_m(R)-\Omega_p t)\tag{3}$$ which is the sum of terms of indices $m$. $A_m(R)$ is the radial amplitude, $\theta_0$ is some reference angle, $\phi(R)$ is a function that determines how the arms wind, and $\Omega_p$ is the pattern speed. I’ll neglect $\Omega_p$ for now, and look only at the density at $t=0$.

Antoja et al. decided to keep only the $m=2$ term. Normally, the $m=0$ and $m=2$ terms dominate (with occasionally a smaller $m=4$ term providing richer structure), but this model is simpler. They used the simple radial profile $$A_2(R)=-A_{sp}Re^{R/R_{\Sigma}}\tag{4a}$$ with scale length $R_{\Sigma}$. $\phi(R)$ is, in general, a little more complicated. Their choice (denoted $g(R)$) is fairly standard: $$g(R)=\left(\frac{2}{N\tan i}\right)\ln\left(1+\left(\frac{R}{R_{sp}}\right)^N\right)\tag{4b}$$ where $i$ is the inclination of the arms and $R_{sp}$ is another scale length. We assume that $N$ is large. In reality, $N\to\infty$, but taking $N=100$ is good enough. All that remains is to insert their parameters. For many, there are ranges, so I’ve picked ones that are roughly average, for the Milky Way: $$\begin{array}{|c|c|} \hline \text{Parameter}&\text{Best-fit value}\\ \hline A_{sp} & 1000\text{ }[\text{km s}^{-1}]^2\text{ kpc}^{-1}\\ \hline R_{\Sigma} & 2.5\text{ kpc}\\ \hline i & 14^{\circ}\\ \hline R_{sp} & 3.1\text{ kpc}\\ \hline \theta_0 & 74^{\circ}\\ \hline \Omega_p& 15\text{-}30\text{ km s}^{-1}\\ \hline \end{array}$$ Now we go to Mathematica. The density, $\rho$, can be found by Poisson’s equation: $$\nabla^2\Phi=4\pi G\rho\tag{5}$$ where $G$ is the gravitational constant. It is much easier to go from potential to density than density to potential, and all we have to do for the former is use Mathematica’s Laplacian operator. Here’s the code I used, with all constants scaled to SI units:

G = 6.674*10^(-11)
Asp = 1000*1000000/(3*10^(19))
rsig = 2.5*3*10^19
inc = 60 (*degrees*)
Points = 100
rsp = 3.1 *3*10^19
theta0 = 74 (*degrees*)
(*Omega =22.5*3.2408*10^(-17)*)
A[r_] := Asp*r*Exp[-r/rsig]
g[r_] := (2/Points*Tan[inc Degree])*Log[1 + (r/rsp)^Points]
potential[r_, theta_, z_] := -A[r]*Cos[2*(theta - theta0) - g[r]]*10^5
density[r_, theta_, z_] := Evaluate[(1/(4*Pi*G))*
    Laplacian[potential[r, theta, z], {r, theta, z}, "Cylindrical"]]
flatDensity[r_, theta_] := density[r, theta, 0]
RevolutionPlot3D[
Evaluate[flatDensity[r, theta]], {r, 3*3*10^19, 10*3*10^19}, {theta, 0, 2*Pi},
    Mesh -> None, ColorFunction -> "DarkRainbow"]

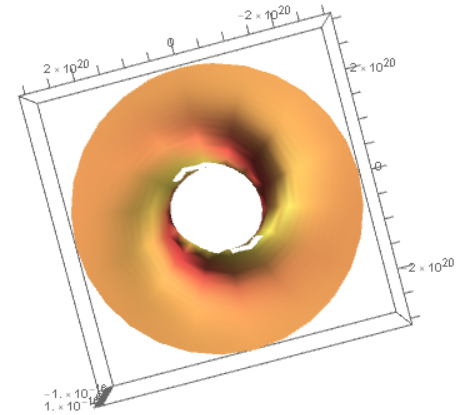
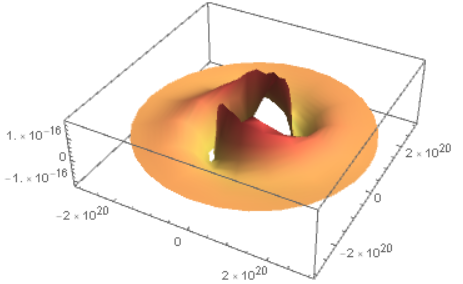
There are a few things to note here. First, be careful to put the value for $i$ in degrees using the Degree option; trigonometric functions in Mathematica assume the value is in radians otherwise. Second, I’ve had to make two modifications to make the output visible. I changed the inclination to $60^{\circ}$ to make the winding clearer, and I multiplied to density (actually, the potential, as well) by a factor of $10^5$. Without that, RevolutionPlot3D and the other operations really choke. When looking at the output, then, be mindful of that factor of five orders of magnitude.
enter image description here
Side view of the density graph.

enter image description here
Top view of the density graph.

The spiral structure should be quite evident here. However, there are two perturbing details. The first is that there is explosive growth near the center. I’ve deliberately truncated the inner radius to $3\text{ kpc}$, which is where the spiral structure really starts. A different density profile is needed there. At radii similar to the Sun’s orbital radius, our density profile is sufficient. Eventually, at large enough $R$, $\rho$ actually becomes less than zero, but we should treat that as an unphysical result and assume that the profile is truncated once $\rho=0$. This happens around $\sim8\text{ kpc}$, indicating that we need to add a value for $m=0$. The exact fitting for that can be handwaved a little, but in the spiral arms, it appears that the results match local mean densities to within a few orders of magnitude ($\sim10^{-18}\text{-}10^{-20}\text{ kg/m}^3$, which isn’t too bad).

Let’s say, then, that we add this $m=0$ term to avoid negative densities. If we want $\rho>0$ out to about $12\text{ kpc}$, then we need it to be around $\sim2.45\times10^{-18}\text{ kg/m}^3$. Again, at smaller radii, this will produce larger-than-usual densities, but it is necessary to avoid unphysical results.

How much of this is stars, though, and how much is gas, dust, and other objects? I’d be comfortable with approximating the stellar density as roughly our figure from above. Dark matter follows a roughly spherical halo distribution, often described by a Navarro-Frenk-White (NFW) profile. The disk density distribution, then, describes stars and other luminous matter, as well as gas and dust. From what I’ve read (see e.g. this Physics Stack Exchange question and answers), roughly 75-90% of baryonic matter in the disk is in the form of stars and related objects, which I’m really comfortable with rounding up to 100%.

Stars have different masses, distributed, in general, according to an initial mass function (IMF). I’ve talked about this in more detail before, and I suspect that nobody’s too eager for me to rehash the necessary sections. Essentially, though, you calculate the total number of stars over a given mass range and then calculate the total mass of all of those. You then scale that to match the total stellar mass of the galaxy, which is done by integrating the density function over the relevant area. Doing so would require multiplying our current expression by some sort of exponentially decaying function of $z$, which I suggested earlier. Again, the specifics vary; take your pick.

Once we’ve done this, we have a value of $n(R,\theta,z)$, the number density of stars at a certain point. To figure out what a stellar population looks like in a given area, simply calculate the mean inter-particle distance, $\langle r(R,\theta,z) \rangle$: $$\langle r(R,\theta,z) \rangle\propto(n(R,\theta,z))^{-1/3}\tag{6}$$ At radii similar to the Sun’s orbital radius, we should see separations on the order of a few light-years. You can pretty easily, then, create a small group of stars with the same mean separation (at large radii, number density is approximately constant), and simply add some random perturbations. Distribute the masses according to an IMF, and voilà!

$\endgroup$
0
0
$\begingroup$

World Modeling and World Building inform each other. It can really help to have a real galactic and planetary model to play with while crafting.

With great effort, I once assembled a starmap.zip including all the constellations and their exo-planets (as of 2004). Includes stars within 50 parsecs of Sol, and is a geocentric coordinate system.

The astronomical data comes from the HYG catalog and uses the Bayer-Flamsteed (Brightstar) naming convention. 3D coordinates were calculated from luminosity values (also given), along with the stellar classification for each star.

I even made up some gamified names (related to their discovery date) for the planets, and gave them a few moons. There are over 3000 stars and over 30 exo-planets, which makes a nice looking sky.

For example, star 18 Scorpius is listed as 18 Sco in the stars.hyg.csv file:

 18    Sco      16.26031482 -8.36823651 14.02524544 G1V             0.652


Also included in the zip is the line data for constellations (connect the dots). I made some icons for the constellations as well, which are nice.

Here is the line data for Scorpius from starlines.hyg.csv

  9Ome1Sco   14Nu  Sco
 14Nu  Sco     Xi  Sco
   Xi  Sco    9Ome1Sco
  9Ome1Sco    7Del Sco
  7Del Sco    6Pi  Sco
  6Pi  Sco    5Rho Sco
  7Del Sco   20Sig Sco
 20Sig Sco   21Alp Sco
 21Alp Sco   23Tau Sco
 23Tau Sco   26Eps Sco
 26Eps Sco   26Eps Sco
 26Eps Sco   26Eps Sco
 26Eps Sco   26Eps Sco
 26Eps Sco     Mu 1Sco

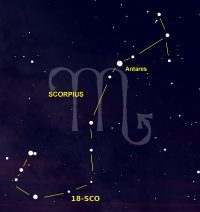
and here is the icon for Scorpius:

enter image description here

Should look something like this when rendered (from Earth):

enter image description here

Note that 18-Sco is not part of the line data, but I rendered it's location for context.

By adding attributes the planets.csv, you should be able to model any world. Again, the craft of World Building should inform the model.

For example, here are 3 acutal exo-planets orbiting 47 Ursa Major for the planets.csv file.

You can add columns to give your planets any attributes you wish.

 47    UMa   B   Zirgu      0   1   5.2     11.21    false
 47    UMa   C   Macbeth    0   2   10.2    11.21    true
 47    UMa   D   York       0   3   15.2    11.21    false

Here is a video of the model in action!

$\endgroup$
-2
$\begingroup$

Seems like a lot of effort to get very little reward.

Your goal is story telling, not modeling the galaxy.

There are perhaps 400 billions stars in the galaxy and you need maybe a hundred, perhaps a thousand at most for a comprehensive story.

Pick the most promising/interesting ones that might be useful for colonists/explorers and work from that data set. Work out the most likely paths for travel and what features of this will be of interest to your story.

But expending effort trying to recreate a model of this is pointless.

I always like to reference Issac Asimov's Foundation series of stories. He was a Phd in science and yet he simply wrote what he needed to write, not what precisely modeled anything. The precise position of things is not needed, but the rough relationship of things and people to each other is. Detail isn't needed. Frankly I think many modern writers get obsessive about detail and forget the storytelling part.

So pick the stars you want to be in your story universe and work from that.

$\endgroup$

You must log in to answer this question.

Not the answer you're looking for? Browse other questions tagged .