9
$\begingroup$

There are a bunch of questions here that require knowledge on ''which technology is a prerequisite for which'' (for example here, here or here).

I was wondering if there was ever any attempt to compile a comprehensive graph from these prerequisite relationships of human technology.

(More specifically, it would be a DAG, as the ''prerequisite of'' relation is directed, and we can't have cycles.)

I understand that this is a complicated issue even theoretically (primarily as these relationships are not static, they evolve over time), and is downright impossible to completely answer practically (as the number of nodes and edges, and the research to correctly identify them would be enormous, for minimal practical value), but hey, it is fun, and people have done a lot of things for fun with little practical purpose, so who knows...

What I have considered:

  • Input-output analysis (in particular, input-output tables): these are widely available, but are at sector-level, not individual technology-level, and they also reveal nothing about the ''prerequisite of'' relationships.
  • Material requirements planning: it is very close to what we need, but it is too microscopic, it is about components required for a product, not technologies required for a technology.
  • Technology tree: this is close to what we need, but the concrete examples in games are widely stylized and simplified (show several order of magnitudes smaller number of technologies than in reality).
$\endgroup$
10
  • 6
    $\begingroup$ A heady undertaking you propose: the epistemology of technology crossed with sociocultural cross currents and historical examples. A PhD thesis easily and possibly a life's scholarly work. I dig stuff like this, but I think the perspective to include all technology would be from such an altitude as to lose the fun details. For example, I have been looking for years for a book about the history of iron - the tech that made it possible, its discovery and dissemination etc. Link welcome if someone knows of such a book! The scope of what you propose is much bigger - awesome and ambitious. $\endgroup$
    – Willk
    Commented Oct 10, 2020 at 15:48
  • $\begingroup$ @Willk "and possibly a life's scholarly work". Sure. I'd say even more, as this can be only imagined as a collaborative project with many people for different domains. But given that someone spent four years to take an underwater photo of a beaver, who knows... $\endgroup$ Commented Oct 10, 2020 at 16:24
  • $\begingroup$ @Willk: H. R. Schubert, History of the British iron and steel industry from 450 BC to AD 1775, London, 1955. Hillary Bauerman, A treatise on the metallurgy of iron, London, 1890. Charles Singer, E.J. Holmyard, et al., A History of Technology, Oxford University Press, 1954; volume I, volume II, volume III. $\endgroup$
    – AlexP
    Commented Oct 10, 2020 at 17:49
  • 3
    $\begingroup$ See this answer of mine, and please oh please read Leonard Read's 1958 essay I, Pencil, in which the pencil, speaking in the first person, "details the complexity of its own creation, listing its components (cedar, lacquer, graphite, ferrule, factice, pumice, wax, glue) and the numerous people involved, down to the sweeper in the factory and the lighthouse keeper guiding the shipment into port" (Wikipedia). It is a great introduction. $\endgroup$
    – AlexP
    Commented Oct 10, 2020 at 17:54
  • 1
    $\begingroup$ Thanks @JBH for this plan! While it has a quite different focus, it look rather awesome (and also shows the difficulties...). $\endgroup$ Commented Oct 14, 2020 at 10:44

3 Answers 3

8
$\begingroup$

No. Because technology can be subdivided into ridiculously small units.

Integrated circuits are a technology. Humanity researched ICs successfully in 1959.

But we've come along way in 60 years - we couldn't make a 64 core cpu in 1960. So it's obvious we need to subdivide "IC" into many sub technologies.

Just where to subdivide is a mess. We can do it based on transistor density, we could do it based on trace width, or various milestones in there.

You'll end up with various milestones of ICs that go into details far beyond what you'll need. Do you really care about 2d, 2.5d, and 3d fabrication technology as their own discrete technology? Do you really want to have 19 and 14nm circuit printing as separate technologies?

What about a new design principle for the IC? Or a new algorithm to automate the layout? Aren't all of these their own technology?

And we forgot about old technologies that are still improved upon. Writing is being improved upon (New words are added all the time, did we research "lol" and "brb"? - textspeak was a new way to communicate so deserves to be a technology. And is every release of the unicode standard a new tech? Are new emojis "researched"?), ceramics and clay have advancements even now yet we researched them thousands of years ago. Every day I get something in my feed about a new plastic that revolutionises 3d printing - plastics been around for about a century and theres new technologies coming out all the time.

Python 3.9 came out today, that has many new features, some of which I've never seen before in any computer programming language. That's a new technology in my opinion.

Your technology tree is actually going to need dummy nodes to avoid cycles, as there are technologies that depend on themselves. An example is C++ compilers - "Clang version N" is built by "Clang version N" so has a self dependency. Resolving this is possible through some clever intermediate builds.

Your technology tree will basically be the worlds list of patents (expired and active, plus some for things like "fire") sorted topologically. This would be a massive project, and out of date as soon as its finished.

$\endgroup$
3
  • 1
    $\begingroup$ Great answer, thank you! I was thinking about saying if we could meaningfully give a threshold that defines what constitutes a "new" technology, and that's a separate question, but I think you convincingly show that it is impossible. I can only image it in a way without threshold: a graph of graphs, where you could zoom into each node, to reveal its "content". But yes, this is neverending, and while I still consider this solution theoretically feasible, I understand that it'd require infinity to the square effort just to get it done for a given date (sans updating...). $\endgroup$ Commented Oct 10, 2020 at 16:32
  • $\begingroup$ Zooming will break the directiveness of your graph. "Windows 10" required "Visual Studio 2010" to create, which required "Windows Xp". If you zoom out far enough that windows 10 and xp are merged, you get a cycle in your graph. Same with many precision machining techs - you needs part accurate to n to make a machine which can makes parts accurate to n. $\endgroup$
    – Ash
    Commented Oct 10, 2020 at 16:50
  • $\begingroup$ Yes, that is correct. It is related to the temporality of the whole graph (see my comment below the question). $\endgroup$ Commented Oct 14, 2020 at 10:16
5
$\begingroup$

Maybe with AI for modern times in a patent mapping way

Thinking of a technology tree like in a game with prerequisites for each technologic step is incorrect. Many technologies can be invented via different routes with different prerequisites. For example, chemicals can be created via different synthesis processes making the end result the same but not how you get there.

I think a better way to see the technological landscape is like a network with all interconnected relationships. Some technologies have hard prerequisites but most have hard to soft connections. For example, for a rocket ship you in principle would not need knowledge of a combustion engine (we might have gone to electric engines straight away), but it will probably help. You would need knowledge of propellant however to get your rocket of the ground.

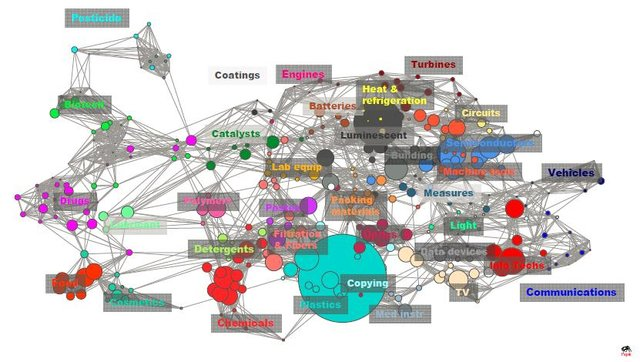
The best way to see interlinking between technologies is to look at the connections between the scientific papers written and what articles they refer to. Already there exists AI that map all interconnections between articles and define the keywords as technology field. An example of such mapping based on patent mapping for the 3D printing field is shown below.

Figure 3. Patent overlap mapping of 3D printing in 1985-2014 by research fields. Alan L. Porter2017

Patent overlap mapping of 3D printing in 1985-2014 by research fields. Source: Huang, Y., Zhu, D., Qian, Y. et al. A hybrid method to trace technology evolution pathways: a case study of 3D printing. Scientometrics 111, 185–204 (2017).

As can be seen it becomes quickly very interconnected. Another way to view it are heatmaps, read the article for an overview of more concepts.

Nowadays or in the near future AI should be able to do this for the complete digital scientific library to give a clear view of all interconnections between technologies. How to make it useable and understandable for humans is another question. Only the digital scientific library is crawlable for AI, but enough scientific history book are present that it will give a good overview of older technology.

$\endgroup$
1
  • $\begingroup$ Thanks for the citation and the idea! $\endgroup$ Commented Oct 14, 2020 at 10:45
1
$\begingroup$

If I were to create such a graph, I would start out be extracting the relationships between Wikipedia articles concerning technology (which article links to which other article). The first challenge would be selecting the articles, because there is no general "technology" category. (You could exclude people and places, include certain other categories and work from there.) Then you'd have an undirected graph, which you have to manually edit to make into a DAG. (Maybe you could start with giving the technologies a date - the first date in the "History" section. Not always correct, but better than nothing.)

$\endgroup$

You must log in to answer this question.

Not the answer you're looking for? Browse other questions tagged .