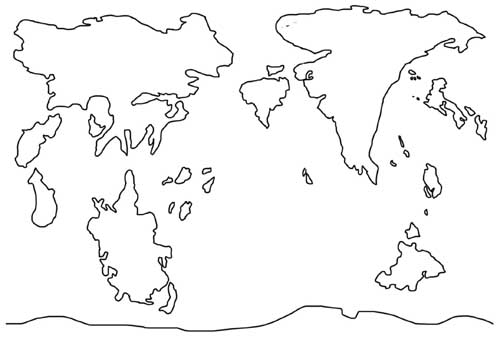
I'm having trouble figuring out the various biomes for my planet. I have extensively read the post on "Creating a realistic world map - Currents, Precipitation and Climate". But to be honest, I'm hung up on my map projection and getting the latitudes correct. My mind just can't seem to get over the hurdle that the land masses are distorted and how to correct for it. Any help would be appreciated.
-
$\begingroup$ your climates will be very similar to earth since the land masses are in very similar places, only the two western most islands will give you any trouble since they are no earthly equivalents. $\endgroup$– JohnCommented Jan 22, 2018 at 0:21
-
1$\begingroup$ @John that assumes that the planet is the same size and temperature as Earth and that the oceans are the same salinity as Earth. Maybe some other assumptions. But if it is generally Earth-like, then I think John is correct. $\endgroup$– SRMCommented Jan 22, 2018 at 5:46
-
1$\begingroup$ @SRM Yes I Forgot to say this assumes the planet is the same as earth is everything but land mass distribution. changes in size, inclination, atmospheric composition, or orbit will all have large effects. $\endgroup$– JohnCommented Jan 22, 2018 at 15:25
-
$\begingroup$ @OCA@blu you may want to add what is and what is not the same as earth besides the continent position. The next step will be working out where your mountains are. $\endgroup$– JohnCommented Jan 22, 2018 at 15:32
4 Answers
Getting all the way to biomes is a multi-step process, at least in my experience. You can't just start with a simple map of the continents and expect to skip straight to biomes and climates. In describing the various steps of generating a fictional climate map (be warned that you can't really do them out of order), I'll be assuming something generally Earth-like that spins the same way; reversing the spin would reverse directions for winds and ocean currents, and going too far from Earth-like conditions (10-hour day, excessive heat, etc.) would probably invalidate most of these guidelines. I'm also ignoring realistic mountain ranges here; plate tectonics would be a good idea to look into, but not strictly relevant for climates except over a geological scale.
Elevation
You need to start with a respectable altitude map; if you're doing this on paper, expect to print out a lot of copies, because this is your baseline for everything else. At minimum you need to be able to easily divide these categories, probably by color on the map: deep ocean, shallow ocean (<300m deep), lowlands (<1000m), highlands/plateaus/etc. (~1000-2000m), and mountains (anything higher). More detail is better (divisions every 1000m of elevation on land would be a good idea) so you can get more accurate results, but not strictly necessary.
Ocean Currents
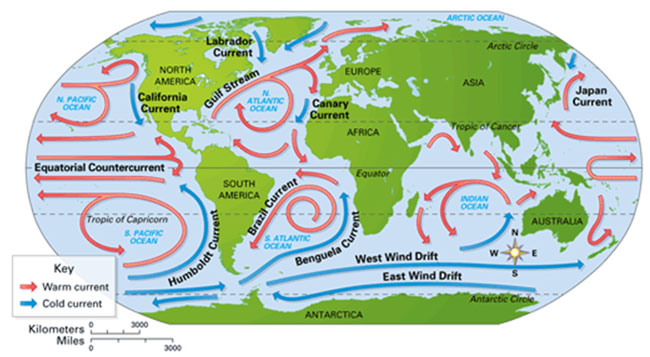
Ocean currents generally follow some straightforward rules, but this example of Earth's currents will likely be useful. For this, you're mostly going to be using latitude lines, so make sure your map has those on it.
You start with two currents flowing westward near the equator (around 5N/5S); if you decide to have your planet spin in the opposite direction of Earth, this is one of the things that will reverse direction. Whenever those currents hit a major landmass, they will be deflected north or south as appropriate towards the poles. They will generally go more or less straight at first, but at around 35-45N/S they will be deflected eastward by wind patterns; if they run into a landmass jutting out before then (see India), they will bend sooner. Follow them eastward on that latitude line (around 45N/S generally) until they hit land; generally, the current will split at that point into north and south currents (one going to the equator, the other heading to the relevant pole). There will be polar currents as well, flowing eastward at around the 60N/S lines.
The general rule with ocean currents is that they should always make closed patterns, typically circles; if you have a current that just stops at land with nothing continuing it, you've probably made a mistake. You might have to draw in some additional currents to have it make sense. Currents tend to run in force only through deep water; a continental shelf (which tends to be shallow for ocean water) might as well be the continent proper.
It's important to separate the currents by type: warm, neutral, and cold. Basically, currents heading towards the poles are warm, while currents heading back to the equator are cold, and everything else is neutral. It's entirely plausible to have a warm current at 70N/S (see the coast of Norway) and a cold current at 10N/S (see western Africa). A quick tip: the western coast of a continent tends to have a cold current when between 10-45N/S, but a warm current from 45-60N/S (reverse this for the eastern coast).
Air Pressure Systems
This one is somewhat harder. You're going to need two different maps here to cover summer and winter (I'm going to refer to this as northern summer/northern winter, because the southern hemisphere will be in opposite seasons, but you can call them the hot and cold seasons or whatever else suits you), because air temperature has a significant impact on these matters. Smaller islands are effectively negligible in this section; overland refers to large continents, so something like Hawaii or Iceland has no meaningful impact.
You need to chart the ITCZ line first. This is near the tropics and is a consistent low-pressure zone, but it does move slightly over the seasons. Draw a line at about 10N/S (whichever hemisphere is in summer) across the ocean eastward until you hit land. Your line is going to get pulled slightly towards the pole by continents, most noticeably on the eastern coast, but not too far; the strength of the effect depends on the landmass, and if the ITCZ hits the 20N/S line, either you've made a mistake or your map has something with the general size and placement of Asia. If you go past the tropic lines (23.5N/S), that's a problem unless you have a giant Pangaea in one hemisphere. Note that this assumes an axial tilt equal to Earth (23.5 degrees); adjust the axial tilt, and the suggested latitudes will need to shift appropriately.
High-pressure systems are likely to form over the sea at around 30N/S in winter, generally on the eastern side of an ocean (near the western coast of a continent); in summer, move them to 35N/S. Overland, you only get high-pressure zones in winter; as a rule, a larger continent means higher pressure and a larger high-pressure zone (Asia has a monstrous zone in January).
Low-pressure systems in oceans tend to form around 55N/S in winter, and at 60-65N/S in summer; these will span most of the ocean at the relevant latitudes. Overland, they only form in summer; draw them mostly closer to the eastern coast, and once again a larger landmass reflects a larger low-pressure zone.
Winds
I hope you appreciate circles because this section will have lots of them. Once again (like most of the later sections), you're going to need separate maps for the northern summer/winter. Generally, wind currents flow from high to low-pressure zones, subject to the interference of mountain ranges and the like. They flow in a clockwise direction out of high-pressure zones in the south, but a counter-clockwise direction out of northern high-pressure areas: this diagram might be helpful. Low-pressure zones reverse this; northern zones generally have winds entering in a clockwise fashion, or counter-clockwise in the southern hemisphere.
High pressure zones will blow winds out in all directions, so you're going to be drawing lots and lots of arrows. Anything going towards the poles (>45N/S) will quickly shift direction eastward due to the westerlies. Winds blowing towards the equator will gradually be blown westward as they move towards the equator; these are the trade winds.
Low pressure zones (including the ITCZ) will act like magnets, drawing in nearby winds, but it's quite possible to have wind passing between high and low pressure zones without entering either one if the rotation mentioned above results in the correct direction; if both zones are sending winds in the same direction, winds in between will likely be following that same direction instead of moving into the low pressure zone. This can also happen if you end up with a mountain range blocking the way, like the Andes.
Also make sure to draw the winds (following the clockwise or counter-clockwise rotation as appropriate) even inside the high/low pressure zones. These winds will be weak, however, if the zones are of significant size.
Temperatures
This is a tough one. Again, you'll need summer/winter maps.
First, map out some key influences. Ocean currents (warm/neutral/cold) and continental influence are the relevant ones here; if necessary, get an extra pair of maps for these. The current influences are coastal, and affected to some degree by wind; if your wind map has air blowing over the appropriate current type (neutral is essentially a transition, typically around 45N/S, but warm currents in higher latitudes are also likely to qualify as this) onto land, draw the relevant influence a little further into the land. Continental influence tends to fall under high pressure zones in winter, or low pressure zones in the summer. If you have something like Asia, expect its continental influence to be exaggerated near the center. Also, any ice pack situations (see northern Canada and Russia) will be continental as well.
For the temperature guides, I'm relying on these images (source is in the credits):
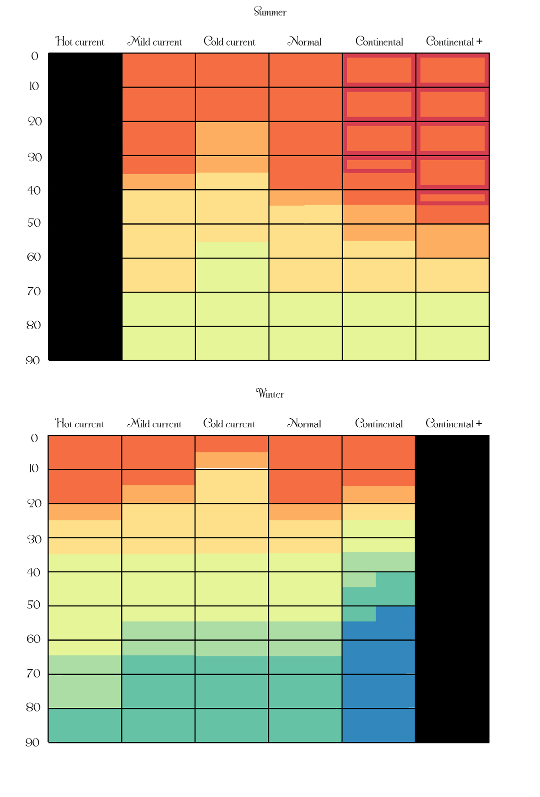
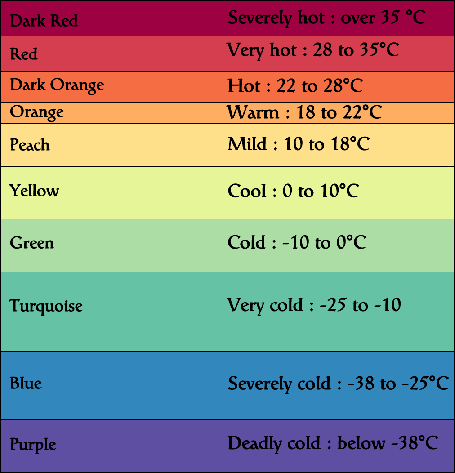
The latitude guides are a general pointer for temperatures at a given latitude, assuming sea level; temperatures will drop roughly 6C for every 1000m of elevation, so mountains will be significantly colder. The last image is a color guide relating the colors in the latitude guides to the appropriate temperature ranges. Continental plus, essentially, is to be used in a central-Asia type of area, so it's not relevant unless you have large continents with probable ice-packs blocking the north or south.
These guides aren't exact (climates being by nature rather inexact when trying to apply what amounts to educated guesswork), so there's a fair bit of fudging involved. Coastal areas tend to have milder temperatures (warmer in winter, cooler in summer), but this doesn't typically apply to inland seas or ice-pack conditions. If you're using the extreme edges of the scale (dark red or purple) in more than very small areas, you'll probably want to do another draft; applied to Earth, this method maps the greatest heat only to small parts of Africa and Australia, whereas the nastiest cold is only in Antarctica or Siberia, or perhaps something like Everest.
A warning here: this assume Earth conditions. Changing the axial tilt, the solar constant (essentially the relation between average orbital distance and the sun's luminosity), orbital eccentricity, albedo, and so on will have a serious impact on the latitude guide. Figuring out precisely how to adjust the latitude guide to match changes in conditions is probably a matter of educated speculation, but I'll try to give a few pointers. Adjusting the axial tilt will have a greater impact at higher latitudes; a larger tilt translates to greater extremes in temperatures. If solar luminosity or orbital distance changes, that will affect your planet's average temperature. In a non-trivially eccentric orbit (I would think e <= 0.03 would be trivial, but that's just my opinion), orbital distance will not remain effectively fixed, which obviously will affect temperatures and probably require you to make separate latitude guides for the north and south hemispheres as well as for the seasons; you'll also need to place perihelion and aphelion in relation to the seasons.
Precipitation
This one is possibly the single ugliest topic (being the most subject to estimation and interpretation), so you should expect to do multiple drafts before you get this right. Get summer/winter copies of your map ready, and make sure you have the wind and air pressure maps at hand. If your map doesn't have longitude lines, you might want to add them now, because they're a useful distance estimate. This is essentially going to be painting a lot of influences, and then estimating total precipitation based on how many overlap at any given area.
Make very sure you pay attention to wind direction; a lot of these factors change drastically if wind is blowing onto shore versus being parallel to it or from land out to the ocean (the former scenario results in more precipitation, while the last one likely means none). Note that a mountain range will, under most circumstances, block any significant rainfall on the other side unless precipitation can come from both sides due to orographic lift (more on this later). Also, inland seas will generally not offer significant material for precipitation, although unusual circumstances might come up.
Start with the ITCZ line. This one is a huge influence, because it draws any winds coming from the equator. It's not quite a guarantee of massive rainfall, it must be noted: the Sahara sits under the ITCZ for half the year, yet it's a desert; to my understanding, this is because the Sahara is too hot for any moisture to really precipitate, no matter how much evaporated from the Mediterranean. Still, this is where the great majority of tropical rainforest is going to turn up. Paint a reasonably thick line (around 10 degrees of latitude) over the ITCZ, and expect a lot of rainfall over this area unless you get a mountain range or something like that in the way.
Next come some effects from westerlies. This starts at around 30N/S in winter (moving poleward), or around 45N/S in summer, and is mostly present on western coasts. You'll get a fairly strong effect on the coast, but it quickly weakens. Winds can carry the effect a long ways inland if blowing in the correct direction, but rainfall will diminish over distance; for any map with an Asia-like continent, it's likely to end up with a desert near the center.
Storm paths are another influence. These are mostly on eastern coasts from 25-50N/S, and are found west of high pressure centers over oceans. These bring a lot of precipitation several degrees of longitude inland if the winds blow directly onshore and still quite a bit even farther inland, but like other influences this one diminishes with distance. As the name suggests, you may want to note these areas as being storm-prone; the best examples of this on Earth are the eastern coast of the U.S.A and the Caribbean, with the hurricanes that so often roll through.
Orographic lift, also known as rain shadow, is another crucial point to take note of. If rain-filled winds get blown onto mountains, the clouds will rise. As they rise, they get colder, and the moisture condenses and falls out of the sky: when they descend on the other side, they warm up again, so any moisture left is unlikely to precipitate. The end result is a lot of rain on one side of the high ground but very little on the other. This is what gets you temperate rainforests like southwestern Canada has, and it's also why plateaus like Iran will generally be dry. The greater the elevation change, the stronger the effect; a mountain range will be more significant than a plateau.
It is crucial to note that ocean currents may play a role here. If you have a cold current near a high pressure zone, any winds blowing onshore over cold currents are very unlikely to lead to precipitation, even if orographic lift would normally occur. This leads to areas like northwestern Africa, which has almost no actual precipitation.
As a general rule, precipitation drops as you move towards the poles; high pressure zones also tend to have reduced precipitation, due to winds rushing out of them instead of into them. Temperatures are notable for certain cases: if you have a sudden rise in temperature, you probably won't get much precipitation. Winds blowing from polar regions are likewise improbable bets for any real precipitation.
Climates
This is what you're ultimately working for, and it's almost anticlimactic that the final step is actually one of the easiest. Take your temperature and precipitation maps (there should be four in all, since you need summer/winter maps for both) and correlate the data at given regions to find your climates; I would recommend the Koppen climates for classification.
I don't think it necessary to spell out all of those climates in detail here, but be warned that your precipitation map is only an approximation and should be used as such; think of precipitation in terms of low, moderate, high, extreme, etc., rather than in exact measurements. If you've got a tropical region that's drenched in one season and bone-dry in the next, for instance, you probably have a savannah climate. If you're not reaching at least moderate precipitation in either summer or winter, you have steppes or a desert (or tundra, if it's cold enough).
Credits
My information comes in large part from Wikipedia (for general knowledge purposes) and from some excellent tutorials at the Cartographer's Guild: this one was of use, and especially here. The latter tutorial is also where all images came from.
-
1$\begingroup$ First off, excellent answer! Might I also add whether or not the axial tilt of the planet would have a part to play within the creation of biomes? I'm not an expert in the matter but I think that it would make sense if they did have a part to play in biome creation... especially if the tilt is extreme ( >40 degrees) $\endgroup$ Commented Feb 7, 2018 at 21:57
-
$\begingroup$ @DiagonalCorgi The axial tilt does absolutely have a role. I didn't explicitly call it out, but axial tilt is effectively what generates the seasons, and it's why most of the components in this guide require separate summer/winter maps. Increase the tilt, and you can expect more extreme temperature ranges (this would result in more widespread continental climates and less of pretty much everything else). $\endgroup$– PalarranCommented Feb 8, 2018 at 0:31
-
$\begingroup$ Also, note that an axial tilt greater than 45 degrees would cause the equatorial regions to receive relatively cooler temperatures for at least half of the year (as the equator would be closer to our own poles during the 'summer' and 'winter' months). This also would cause extreme temperature shifts in the north and south hemispheres from tropical to polar and back again over the course of a year. $\endgroup$– HannahCommented Feb 10, 2018 at 13:08
-
$\begingroup$ @Hannah Nice catch, and absolutely something to remember, but I think at that point you'd effectively invalidate my guidelines. The key assumption is a planet that's generally Earth-like, and an axial tilt that severe is probably out of the scope of this guide to really handle. $\endgroup$– PalarranCommented Feb 10, 2018 at 18:22
-
$\begingroup$ "Also, inland seas will generally not offer significant material for precipitation, although unusual circumstances might come up." Here in Western NY, we get what is called "Lake-effect snow" in the winter. If the Great Lakes haven't frozen over yet and we get a winter storm, the storm can pick up a huge amount of moisture from the lakes, which ends up as a terrible blizzard. The last one made national news, they called it "Snowmaggedon". $\endgroup$– Ryan_LCommented Aug 9, 2018 at 4:40
For a real-world map example to gather information from, such as temperature, precipitation etc, I'd recommend you look at this: Earth: A Global map of weather conditions. You can change the projection and other aspects of it, which may be useful as a guide.
However, for your specific issue with the latitude, I'd start with plotting the equator, and then splitting both hemispheres into 3. The line made closest to the equator will represent 30 degrees (which is usually where, in an Earth-like world, hot deserts are most likely to form), and the line made closest to the poles will represent 60 degrees (where jet-streams tend to be found).
You can also then further split up each section to get more accuracy over latitude - which is more important when placing where your tropics and arctic regions will be - Something that (according to one of Artifexian's Videos) can be derived from your world's axial tilt. To find the edge of the tropics, place a line at the same number as your axial tilt. to find your polar regions, take the number of your axial tilt away from 90 degrees.
Plotting all of this down should help you have a rough guide to figure out where bands of certain climate regions will form. Other aspects such as mountains & landmass size may also have an impact on where certain biomes form, but this is the first step I take whenever I try to figure out where biomes form in my own map-making, so I hope you'll find it useful.
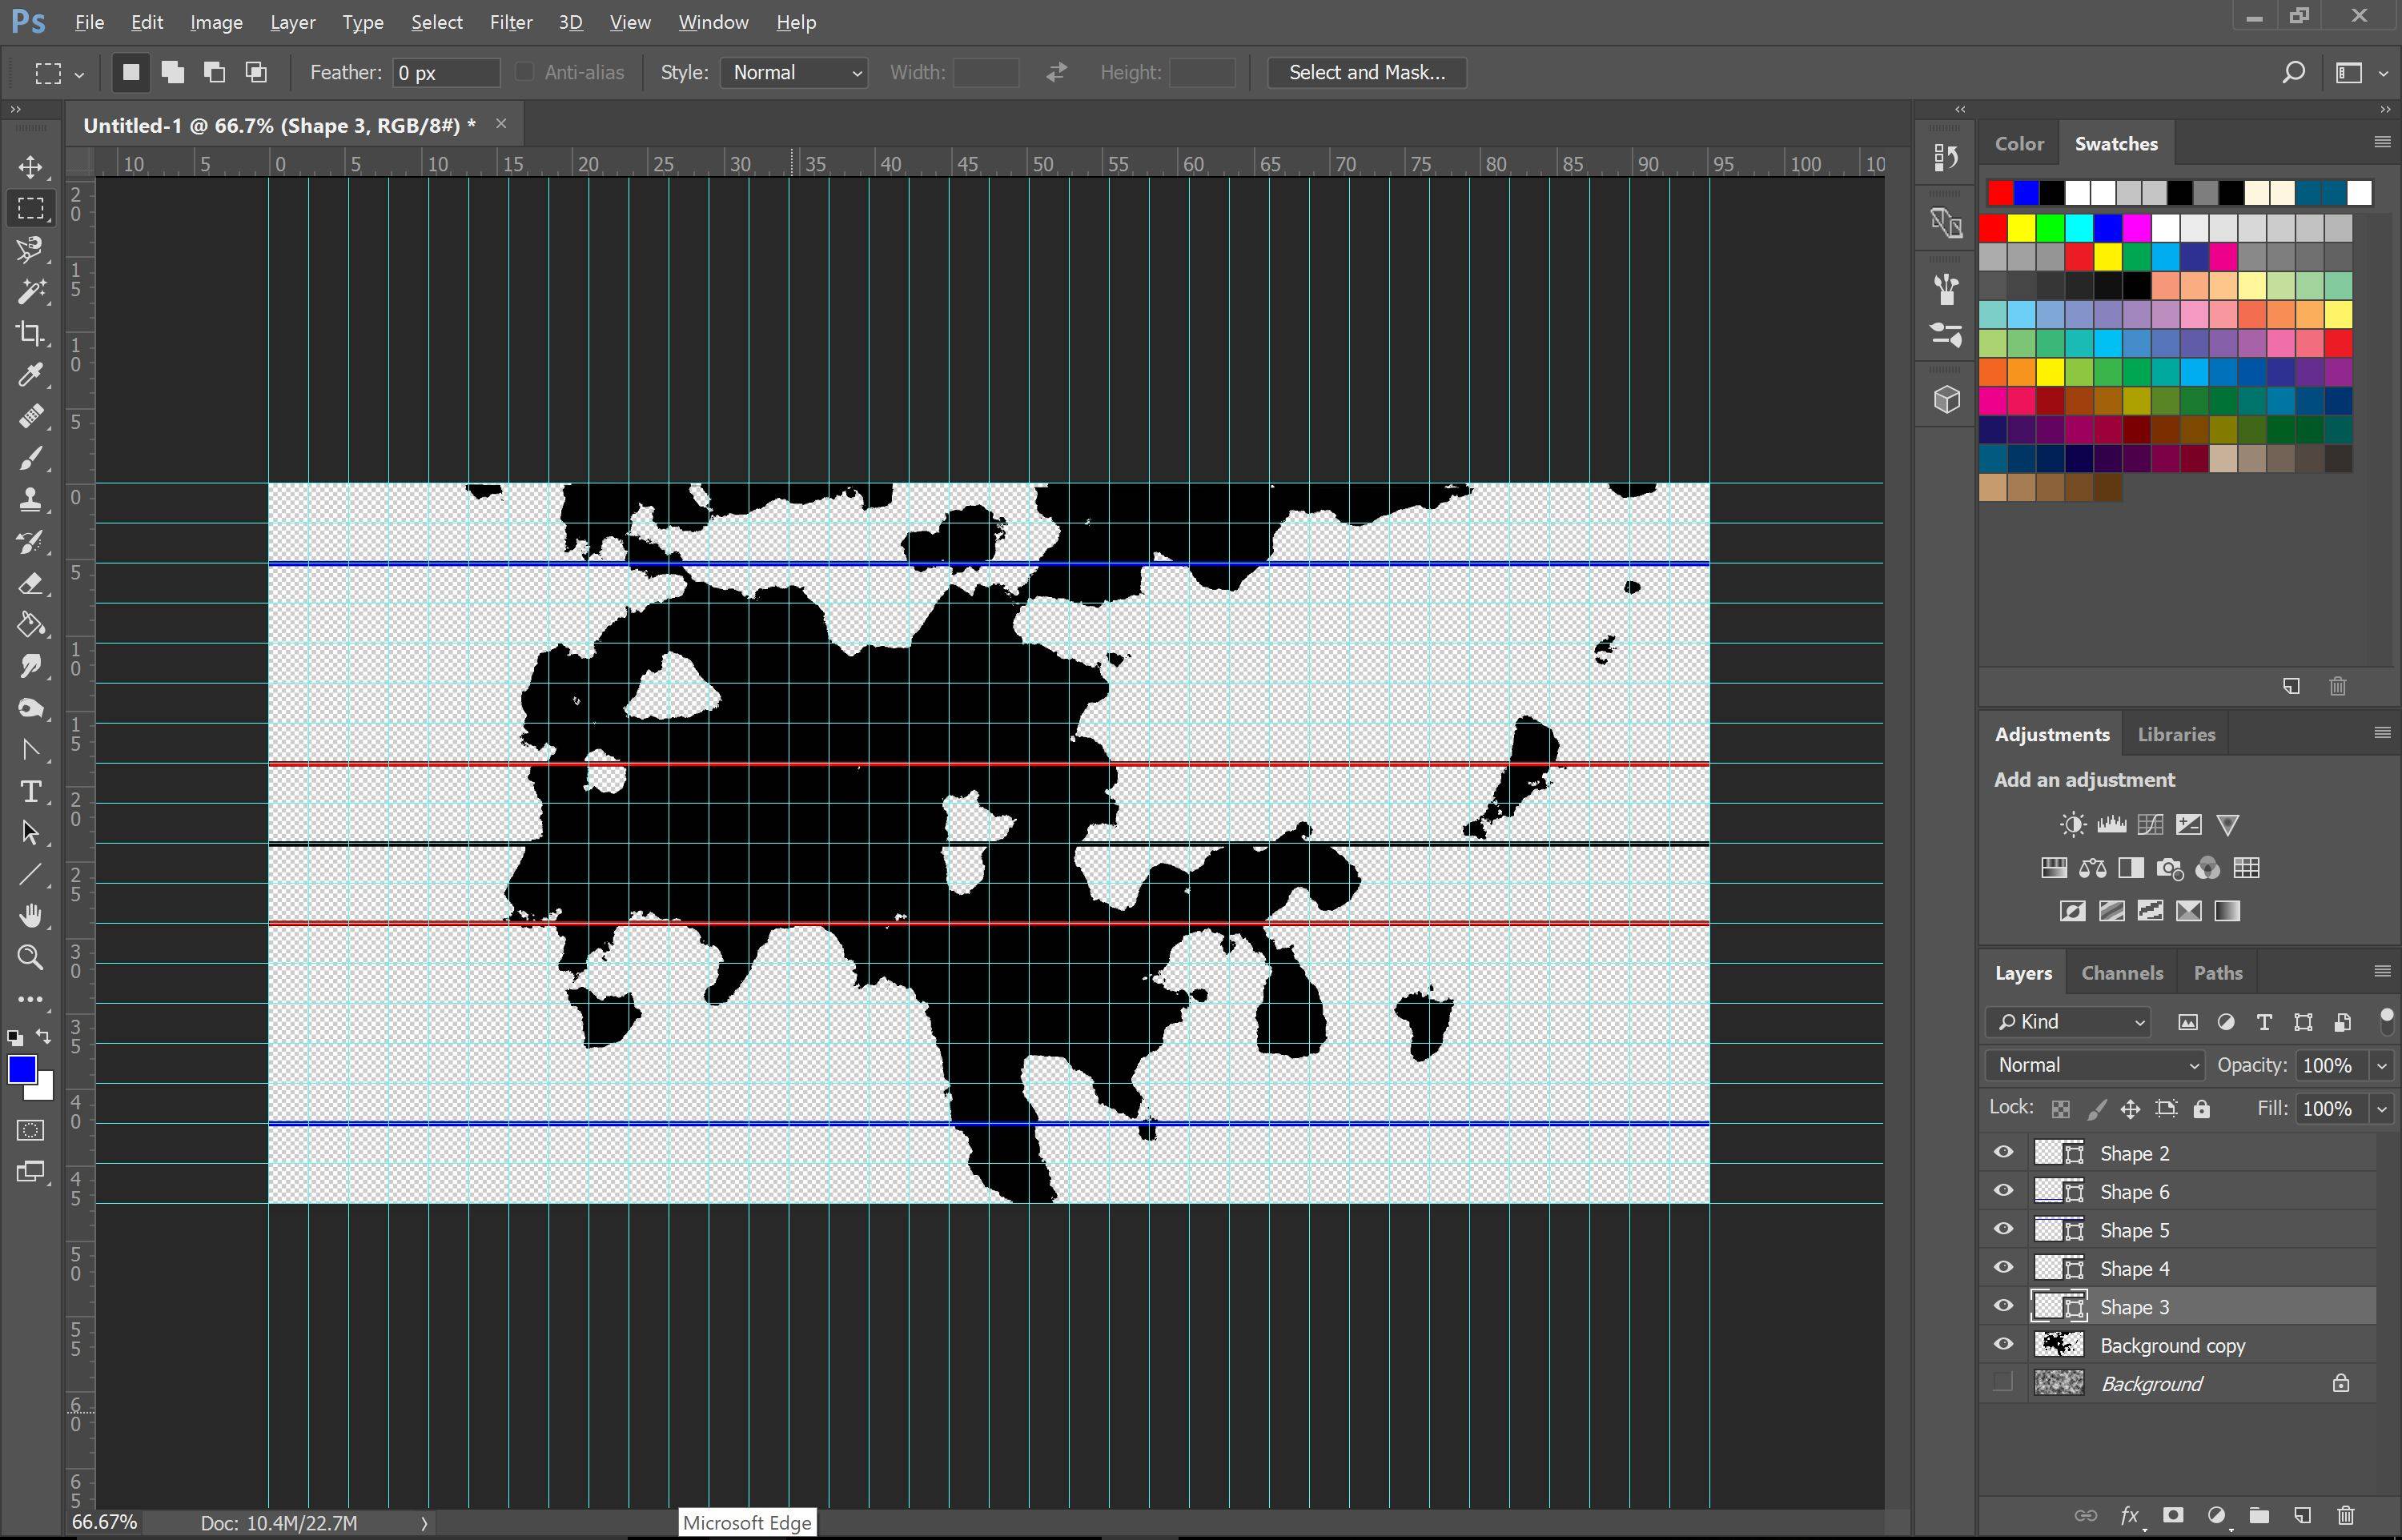 (This was the closest image i could find which kinda shows what i describe that you should do. This is slightly different, as in i mark out the tropics and polar regions (as i never got around to putting in other indicators for this map) but never-the-less)
Try looking towards real life earth for an example. It also depends on the mass and air pressure, a good example is looking at the carribean and looking at ocean currents and air currents so you can see how warm air looks. The only problem I can think of is the wierd tilt the earth has where we rotate slightly differently than where the sun hits us.
TLDR: look at ocean currents and don't be too concerned
First off is the temperature distribution of your planet. On earth, it's hotter around the equator and colder at the poles, though this may not be the case for your planet. This depends on your planets tilt relative to the sun. Once you have that thoroughly established, you can move onto other important factors.
Next is ocean currents. These follow the shape of your landmasses and are huge factors that contribute to climate. Here's how Earths currents look:
Currents will carry temperatures all around the globe, making some beaches cold and others warm, however these temperatures do extend a decent amount inland, and often a regions average temperatures and climate will be related to the temperature of the currents around it. When you get to the societal part of worldbuilding, currents will also establish boating trade routes and the like.
Wind patterns will also follow ocean currents, bringing temperatures with them as well as storms and weather. If there is a rainy area with a south blowing wind, the rain will be carried to those south places.
The next major factor is.. you guessed it, elevation!Hopefully you understand your tectonic plates and their movements well enough, because these decide mountain ranges and other such land forms as well as the elevation of an area. Another general rule is that the elevation is lower near the coast and higher inland, but this might change once other factors come into play. Elevation accounts for the obvious: it gets colder the higher you go, like snow on mountain peaks. However, areas with higher elevation are not only cooler, but also receive more precipitation, because the clouds rise higher, causing them to condense and fall as rain (or snow).
The last major factor I can think of is local geography. A valley might affect the way the wind blows. A mountain will affect precipitation (https://sciencing.com/do-mountains-affect-precipitation-8691099.html). Pretty much every geographical factor will affect the climate of that area, but often it is on a very small scale. Although ofc, if you have a giant mountain range or other feature, this will obviously cause a much greater change in climate.
There is no set climate equation, but each of these factor in. Take each into consideration and your end result will be a realistic climate for that area. Let me know if I missed anything!

